Getting Started
The SC Navigator documentation describes SC Navigator page by page. This means that every page in the application matches to a page in the documentation. However, this particular page called Getting Started is an exception and does not match any page in the application. Instead, the purpose of this page is to describe some concepts/terms which we are using throughout the application and the documentation.
Load Data Dialog
On several places in the application you can load data, see the section Scenario Page Actions for loading scenario data. In all these cases, you will see a dialog like the following:
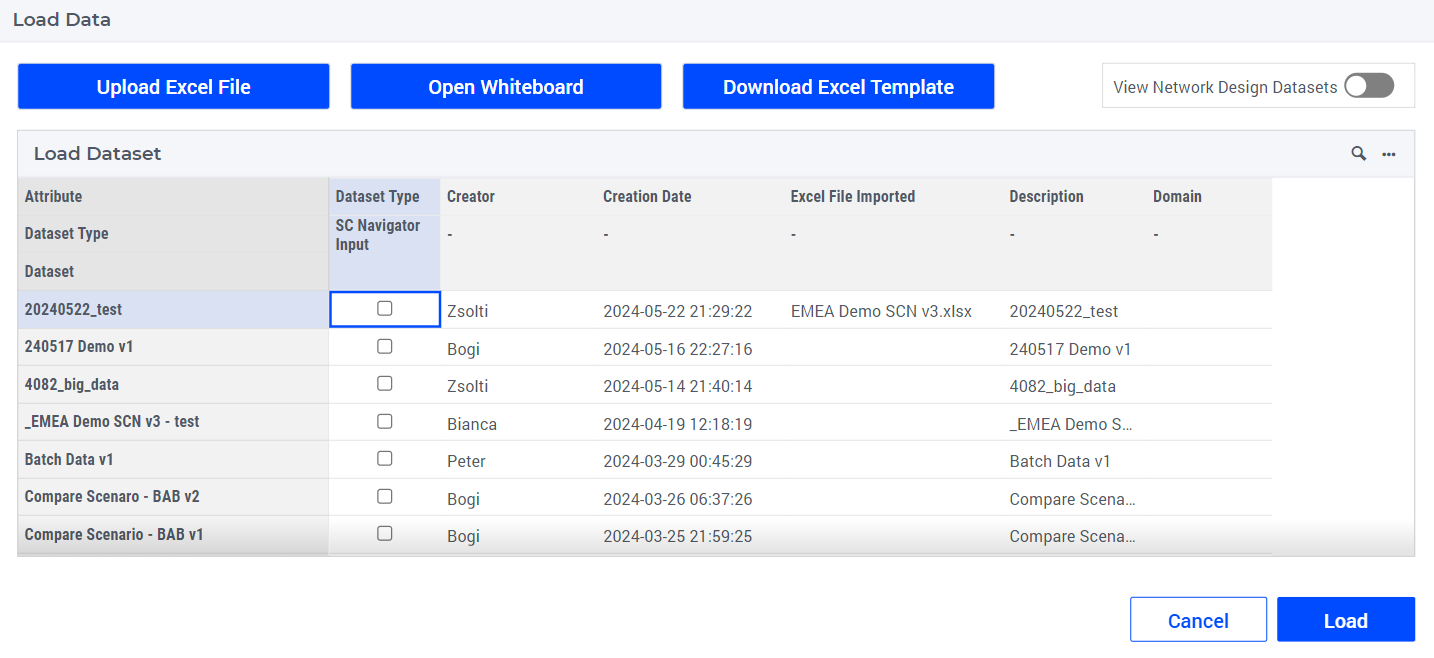
In the top part of this dialog there are three options: Upload an Excel File, navigate to the Whiteboard, and Download an Excel Template. The option to upload an Excel file is only available when loading the input data and not for the scenarios. Navigating to the Whiteboard allows users to create a diagram of their supply chain network. This diagram can be automatically translated into an Excel template that can be uploaded to SC Navigator via the Upload Excel File button.

You can import the data by performing the following three steps:
Click the
 button.
Select the Excel file you want to load.
Click the
 button to import the data.
After the last step the dialog will disappear.
Important
This last step is very important, no data will be loaded if this step is not completed.
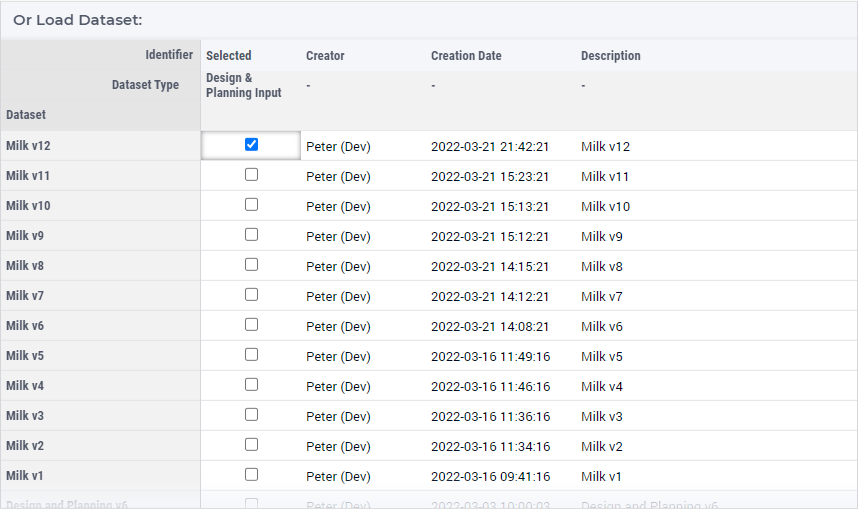
In the bottom part of the dialog (which is the only part in many pages), you can select the dataset (scenario) which you want to load. You can do this by checking the checkbox for the column Selected of the dataset which you want to load, followed by clicking on the Load button in the lower right corner of the page.
Save Data Dialog
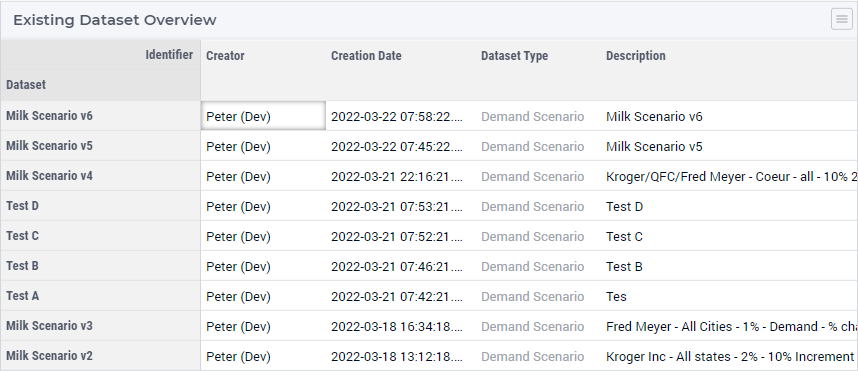
In many cases you can find a Save Data dialog similar to the Load Data dialog. The Save Data dialog page consists of three parts. In the first part you enter the details of the element to be created, while in the second part you see an overview of the existing datasets.
The first part consists of a widget to enter the Name and the Description.

The length of the name must be less than 64 characters. We recommend keeping it short, but still provide some useful information in the name. Furthermore, use the description in order to provide more details, so that the next time you see this name and this description, you know what it is about.
The middle part of the screen shows all the existing datasets. The purpose of showing these is two-fold:
It helps you to see which names have been already used.
It helps you to keep up a certain naming structure.
The last parts is a series of buttons that allow for some export related actions:

Download Solution
The first button is Download Solution which can be used to download the results. The behavior of this buttons depends on the situation, this behavior has changed in version 24.5.1:
If multiple results datasets are being compared, a single file with the data of all these results datasets will be created. The name of the results dataset will be the value of the (new) column “Results”.
If only one dataset is loaded and a “Result Name” is specified, a single file with the data of the current dataset will be created and the specified name will be the value for the (new) column “Results”.
In all other cases, an Excel file will be generated that does not have the (new) column “Results”.
Download E2E Report
The next button is Download E2E Report which can be used to download the E2E Report. Normally the E2E report is included in the Excel file that is downloaded via Download Solution. However, Excel has a limit of about 1 million rows and if we have more than 1 million rows, the E2E report is not included, but can be downloaded separately as .csv via this button.
Export To Database/Export To Data Lake
The next checkbox Export To Database/Export To Data Lake can be used to indicate if the results need to be stored in the database/data lake. Every time you save the results, an element in this list is created, together with a binary file containing all the data, which can be loaded back. However, if you want make these results available outside the application in the database or data lake, you will need to check this box.
Results visible to everyone
The last checkbox Results visible to everyone can be used to indicate that other users should be able to load the results you are about to create.
Page Actions
The buttons in the bottom right corner of a page are called the Page Actions and these may vary from page to page. Once they have been expanded, the page actions look as in the following picture:
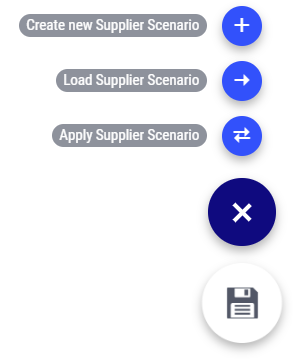
In case there are more than three items, by default the top icon looks like this  . If you click on this, then its contents will be expanded and you will be able to see all items.
Group elements in the Data
There are two ways to specify group data in the Excel file with input data, which are handled differently in the model. Assume that we have a product group Cold Storage Products, then you can use this in the Excel file as follows:
Cold Storage Products
{Cold Storage Products}
If you specify the group element in the first way, then the model will apply the data to all the elements in that group. For instance, if you specify $15 for the attribute Variable Cost and Cold Storage Products, then the model interprets this as the Variable cost is $15 for each product in the group Cold Storage Products.
If you specify the group element in the first way, the model will interpret this in the same way unless that group and attribute are mentioned in the table below.
If a group is specified as {Group} and the group type and attribute are mentioned in the table below, then this value is interpreted as the total for all products in that group. For instance, if you specify the value 150,000 for the attribute Maximum Capacity and {Cold Storage Products}, then the model interprets this as the Maximum Capacity is 150,000 for all products combined in that group.
The following combinations allow for {group} elements. If you specify the brackets {}, but that attribute is not in this table, then SC Navigator will handle this in the same way as without the brackets {}.
Database Table |
Attribute |
Period |
Product |
Resource |
Customer |
Location |
Supplier |
Transportation Mode |
Bill Of Material |
|---|---|---|---|---|---|---|---|---|---|
ProductLocation |
Maximum # of Source Locations |
x |
x |
x |
|||||
ProductLocation |
Maximum # of Destination Locations |
x |
x |
x |
|||||
ProductLocation |
Minimum # of Open Locations |
x |
x |
x |
|||||
ProductLocation |
Maximum # of Open Locations |
x |
x |
x |
|||||
BillOfResource |
Minimum Capacity |
x |
x |
x |
x |
||||
BillOfResource |
Maximum Capacity |
x |
x |
x |
x |
||||
TransportationTypeProduct |
Minimum Capacity |
x |
x |
x |
x |
||||
TransportationTypeProduct |
Maximum Capacity |
x |
x |
x |
x |
||||
TransportationTypeProduct |
Base Case Volume |
x |
x |
x |
x |
||||
TransportationTypeProduct |
Force Open |
x |
x |
x |
x |
||||
TransportationTypeProduct |
Take Or Pay Volume |
x |
x |
x |
x |
||||
TransportationTypeProduct |
Take Or Pay Fixed Cost |
x |
|||||||
SupplierProductStep |
Variable Cost |
x |
x |
x |
x |
||||
SupplierProductStep |
Minimum Capacity |
x |
x |
x |
x |
||||
SupplierProductStep |
Maximum Capacity |
x |
x |
x |
x |
||||
SupplierProductStep |
Force Open |
x |
x |
x |
x |
||||
SupplierProductStep |
Variable Cost is for all steps |
x |
x |
x |
x |
||||
ResourceProductStep |
Variable Cost |
x |
x |
x |
x |
||||
ResourceProductStep |
Minimum Capacity |
x |
x |
x |
x |
||||
ResourceProductStep |
Maximum Capacity |
x |
x |
x |
x |
||||
ResourceProductStep |
Force Open |
x |
x |
x |
x |
||||
ResourceProductStep |
Variable Cost is for all steps |
x |
x |
x |
x |
||||
ResourceProductStep |
Minimum Capacity (Inventory) |
x |
|||||||
ResourceProductStep |
Maximum Capacity (Inventory) |
x |
|||||||
ResourceProductStep |
Target (Inventory) |
x |
|||||||
ResourceProductStep |
Variable Cost (Inventory) |
x |
|||||||
TransportationTypeProductStep |
Cost Per UOM |
x |
x |
x |
x |
||||
TransportationTypeProductStep |
Minimum Capacity |
x |
x |
x |
x |
||||
TransportationTypeProductStep |
Maximum Capacity |
x |
x |
x |
x |
||||
TransportationTypeProductStep |
Force Open |
x |
x |
x |
x |
||||
TransportationTypeProductStep |
Variable Cost is for all steps |
x |
x |
x |
x |
||||
SupplierStep |
Variable Cost |
x |
x |
x |
|||||
SupplierStep |
Minimum Capacity |
x |
x |
x |
|||||
SupplierStep |
Maximum Capacity |
x |
x |
x |
|||||
SupplierStep |
Variable Cost is for all steps |
x |
x |
x |
|||||
SupplierStep |
Limit Openings |
x |
|||||||
SupplierStep |
Maximum Openings |
x |
|||||||
SupplierStep |
Limit Closings |
x |
|||||||
SupplierStep |
Maximum Closings |
x |
|||||||
ResourceStep |
Variable Cost |
x |
x |
x |
|||||
ResourceStep |
Minimum Capacity |
x |
x |
x |
|||||
ResourceStep |
Maximum Capacity |
x |
x |
x |
|||||
ResourceStep |
Variable Cost is for all steps |
x |
x |
x |
|||||
ResourceStep |
Limit Openings |
x |
x |
||||||
ResourceStep |
Maximum Openings |
x |
x |
||||||
ResourceStep |
Limit Closings |
x |
x |
||||||
ResourceStep |
Maximum Closings |
x |
x |
||||||
CustomerProduct |
Minimum Fulfillment Rate |
x |
x |
x |
x |
||||
CustomerProduct |
Maximum # of Source Locations |
x |
x |
x |
x |
Help
On every page there is a Help icon at the end of the status bar. The status bar is located at the bottom of the page and the Help icon on it looks like this  .
.