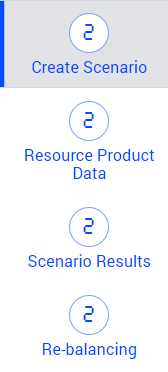
Create Scenario
A scenario consists of your loaded data and possibly one or more modifications to that data. You can make these modifications to be able to see the impact on the inventory levels. You could e.g., increase the desired service level to see how much your safety stock levels will increase. On this first page of phase 2, for regular products you can modify the service levels per segment or per individual customer/location/product. For spare parts you can modify the service level percentages per resource/location/product. Furthermore, there are some scenario settings that you can set. Below you can read more about the widgets on this page. Please note that depending on your configuration, you might not see all these widgets.
Service Level per Segment
The first table shows the service level per segment. If you modify the percentage for one of the segments in this ABC-XYZ table, the percentage is applied (overwritten) to all (regular) products that are included in that segment. The service level percentage is used for the safety stock calculation for regular products.
Regular Products - Segments
The second table shows to which segment a certain customer/location/product combination belongs. This data is based on which regular products are included in which segments. This segmentation is used to assign the different service level percentages to the customer/location/product combinations in each segment.
Regular Products Service Level Percentage
In the widget action menu of the second table, you can switch between the segments data and the service level data. Select Show Service Levels to see the service levels for the individual customer/location/product combinations. You can modify these percentages for the individual combinations. Please note that when you change the service level per segment (in the first table), you overwrite your modifications on the individual combinations.
Regular Products Scenario Settings
When your configuration results in additional options to select from for regular products, the Regular Products Scenario Settings widget is available and can contain:
Demand Type - In case you have both historical and forecasted demand for regular products, you can select which demand type you want to use for the scenario that you are creating.
Number of Periods - If you use Demand Forecasting output for regular products, you can also select the number of periods (3, 6 or 12) that you want to consider for determining the average demand (either historical or forecasted).
Cycle Stock Approach - When calculating achievable service level, re-balancing opportunities and network feasibility, the app needs to know what cycle stock level should be used. You can choose from Average, Minimum or Maximum. When Minimum is selected, the amount of cycle stock from approach is zero. When Maximum is selected, cycle stock from approach equals the calculated Cycle Stock. When you select Average, half of the calculated Cycle Stock is used.
When you change these additional selectors, you can directly see the effect on your inventory values by checking the KPIs or going to Scenario Results.
Spare Parts - Service Level Percentage
The Spare Parts Service Level Percentage table widget shows the service level percentages that are used for the calculation of the amount of stock that you need for spare parts. The widget action menu of this table contains the Set Service Level for Spare Parts action. Clicking on this action results in a dialog where you can enter a new service level percentage. The new value will be applied to all the combinations of resource/location/product that are included in the filters on the side panel. This allows you to easily change the percentage for a selection of combinations. Please note that the Filter Rules (available in the headers of the row and column area of the table widget) are not applied when setting the new percentage.
Spare Parts Scenario Settings
When your configuration results in additional options to select from for spare parts, the Spare Parts Scenario Settings widget is available and can contain:
Select Failure Rate Type - In case you have both Mean Time between Failure/Failure Rate and demonstrated MTBF/Failure Rate, you can select which failure rate type you want to use for the scenario that you are creating. You can select one of the two types for which you have data, but you can also select ‘Best Case’ and ‘Worst Case’. When selecting ‘Best Case’, for each spare part the lowest (less frequent) of the two rate types (for which you have data) is used. When selecting ‘Worst Case’, the highest (most frequent) value is used for a specific spare part.
Last Time Buy Scenario - For spare parts that have a support time specified, you can calculate the total amount of Spare Parts Stock for the full support time by checking the Last Time Buy Scenario checkbox. This can be useful when you need to make sure that you have enough spare part stock for the full support time, because later you cannot buy new items for those spare parts. E.g. when your supplier stops creating those spare parts and you can only buy new items one more time (Last Time Buy). Or you can only buy new items of this spare part once (One Time Buy).
When you change these additional selectors, you can directly see the effect on your inventory values by checking the KPIs or going to Scenario Results.
Product Filter
On the Product Filter panel (at the right), you can select for which products you want to see the data. Products can be grouped in two ways: by segments or by product groups (if you allow product grouping in your configuration). Therefore, the Product Filter contains a multiselect widget for both segments and product( group)s.
If you unselect an individual product, that product is no longer displayed in the data widgets. If you select it, the corresponding data is visible again.
If you select/unselect a segment, the products in this segment are also selected/unselected.
If you select/unselect a product group, the products in this group are also selected/unselected.
As soon as all products in a segment/product group are selected, the checkbox in front of this segment or product group is checked. When there are one or more items in the segment/product group that are not selected, then the checkbox for the segment/group is unchecked. This allows you to easily see whether all items in the segment/product group are selected or not.
The switches on the filter panel can be used to hide segments/products that are not related to the selected products/segments (so based on the selection in the other multi select widget).
Customer Filter
On the Customer Filter (at the right), you can select for which customers/locations you want to see the data. If you have customer and/or location grouping in your data (when you allow this in your configuration), you can also select these groups in the two multiselect widgets.
If you unselect an individual customer or location, that customer/location is no longer displayed in the data widgets. If you select it, the corresponding data is visible again.
If you select/unselect a customer/location group, the customers/locations in this group are also selected/unselected.
As soon as a location that is related to a customer, is selected, the corresponding customer is also selected.
As soon as a customer that is related to a location, is selected, the corresponding location is also selected.
As soon as all locations that are related to a customer, are unselected, the corresponding customer is also unselected.
As soon as all customers that are related to a location, are unselected, the corresponding location is also unselected.
As soon as all customers/locations in a group are selected, the group is selected as well.
The switches on the filter panel can be used to hide customers/locations that are not related to the selected locations/customers (so based on the selection in the other multi select widget).
Resource Filter
On the Resource Filter (at the right), you can select for which resources/locations you want to see the data. If you have resource grouping and/or location grouping in your data (when you allow this in your configuration), you can also select these groups in the two multiselect widgets.
If you unselect an individual resource or location, that resource/location is no longer displayed in the data widgets. If you select it, the corresponding data is visible again.
If you select/unselect a resource/location group, the resources/locations in this group are also selected/unselected.
As soon as a location that is related to a resource, is selected, the corresponding resource is also selected.
As soon as a resource that is related to a location, is selected, the corresponding location is also selected.
As soon as all locations that are related to a resource, are unselected, the corresponding resource is also unselected.
As soon as all resources that are related to a location, are unselected, the corresponding location is also unselected.
As soon as all resources/locations in a group are selected, the group is selected as well.
The switches on the filter panel can be used to hide resources/locations that are not related to the selected locations/resources (so based on the selection in the other multi select widget).
Save Scenario
In the second phase of the workflow, the status bar includes information on the active scenario. Initially, it says “(Untitled)”, as you have not saved a scenario yet.
Once you have saved a scenario, it shows the name of the current scenario. When you then modify any input data, “(Modified)” and a pencil icon will appear to indicate that you have changes that are not yet saved in a scenario.

You can save a scenario in two ways.
You can click on Scenario in the status bar.
You can click on Save Scenario in the page action menu.
The Save Scenario dialog will pop up. Here you can see an overview of the already created scenarios (if any) and you can provide a name and a description for your scenario. If you want others to see your scenario as well, you can make the scenario visible to everyone (within your environment) by switching the Scenario visible to everyone switch. When pressing OK, your scenario is saved and in all 3 ways, you will automatically be directed to Phase 3: Compare Scenarios. Of course, you can go back to phase 2: Create Scenario, to create another scenario.
Please note that you cannot overwrite a scenario, so first make all the required modifications before saving your scenario. A scenario consists of service level data and resource product data, so you might want to check/modify the data on the Resource Product Data page in phase 2 as well.
Load Scenario
You can load a previously saved scenario in two ways as well.
You can click on Scenario in the status bar.

You can click on Load Scenario in the page action menu
If you have not saved your changes in a scenario yet, you will be asked whether you want to save your changes in a scenario. If you’re done, or if you don’t want to save your changes, the Load Scenario dialog will pop up. Here you can select a scenario. There are two switches:
All from current configuration - Turn this switch on to see all scenarios that were saved with the currently active configuration. Please note that they can be created with a different dataset than your currently loaded dataset.
All from all configurations - Turn this switch on to see all scenarios that were saved with Inventory Planning. Please note that they can be created with different configuration and dataset than your currently loaded configuration and dataset.
Click on Load to confirm your choice. When loading a scenario that was created with a different configuration/dataset, the corresponding configuration/dataset is loaded as well.
Delete Scenario
If you want to delete scenarios because you no longer want to use them, you have to go to the Data Navigator app and delete the scenario there. Here you can read how to do this.
Workflow
When you’ve modified all the service levels for the scenario that you are creating, you can go to the next step in phase 2: Resource Product Data.
Help
Read here about the Help panel.