Center of Gravity
The purpose of the Center of Gravity functionality is to determine the optimal locations for the Distribution Centers in your supply chain network.
The app finds the so-called Center of Gravity (in short, CoG) with respect to the customer and supplier locations, based on the amount of demand/supply that these locations have. Each customer/supplier which is considered in the calculations has its own demand/supply load. All these location loads pull on the Center of Gravity until the model finds the optimal location for a distribution center.
You can add generated Center of Gravity locations to the set of warehouses in SC Navigator dataset. See Add CoGs to set of Warehouses.
Run CoG Scenarios
There are three types of calculations which can be executed:
For large datasets these calculations can take some time varying from about half a minute up to several minutes or even hours. For the drive time scenario you can influence this running time by changing (some of) the CoG Settings.
Demand/Supply Distribution Map
The Demand/Supply Distribution Map represents all locations to consider in your dataset. Use the widget action to customize map view settings, see Customization Settings from the main map. Use side panels to filter nodes and arcs.
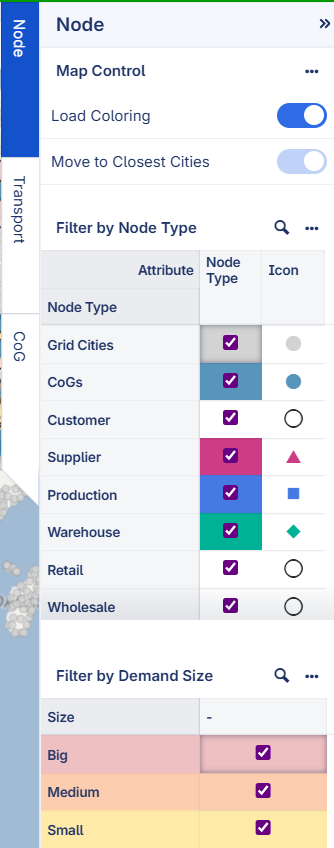
Node Filter
Move to Closest Cities - When solving the Number of CoGs scenario, the Centers of Gravity can end up in e.g. the middle of nowhere, or in the sea. However, it can be more realistic to consider the closest real city for each Center of Gravity found. If you turn on the ‘Move to Closes Cities’ switch, the app will move the found Centers of Gravity to the closest real city. Drive times and costs are updated based on the new locations.
Note that the Max Drive Time scenario works with real city locations, so if you have run the Max Drive Time scenario, the switch will be on and disabled.
Load Coloring - When demand and/or supply data is considered, the Load Coloring option appears. If this option is turned on, the color and the size of nodes represent the amount of demand/supply load for each location: Red - high load; Orange - medium load; Yellow - small load. These labels are relative. The range of all loads being considered is divided into three equal parts.
Node Type Filter - Node Types are usually divided into Customer, Supplier, Production, Warehouse, Grid Cities and CoGs. For Production and Warehouse the groups defined in the dataset are also included.
Filter by datasets - You can filter CoG locations by datasets. This filter becomes available only when at least one CoG results dataset is loaded.
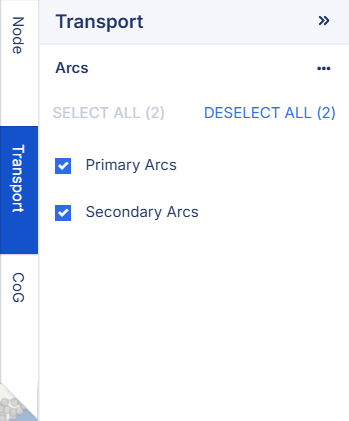
Transport Filter
After the solution has been found, using the checkboxes in the Transport side panel, the network can be visualized on the map. Primary arcs show the connections between CoGs and suppliers, while secondary arcs connect CoG and Demand nodes.
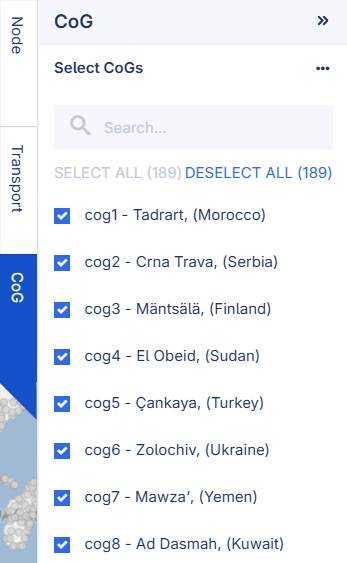
CoG Filter
CoG nodes can be set invisible on the map using the checkboxes on the CoG side panel:
Additional Filters
Next to the Transport filter and the CoG filter, you can filter the map view based on Customers, Suppliers, Products, Periods and Fixed Locations. Those filters offer both group and individual filters. So, for example, on the Customers filter, you can select one or more customer groups, and/or one or more individual customers. The same applies to the other filters.
If you change one of the setting for the above categories on the CoG Settings page, only the relevant filter(s) on the Center of Gravity page will be synchronized with the new settings. For example, if you change the Customer Groups on the CoG Settings page, the Customer filter on the Center of Gravity page will be updated accordingly, but the other filters will remain unchanged. Changing a filter on the Center of Gravity page will not affect the settings on the CoG Settings page.
The Fixed Locations filter will only contain the fixed locations that are selected on the CoG Settings page. If you have not defined any fixed locations there, this filter will not be available.
Results Overview
On this page, the overview of the finished calculation is made available, while on the CoG Run Details page the user can find more information about the created CoGs.
Drive Time Distribution
The Drive Time Distribution bar chart shows the distribution of the drive times from locations to warehouses. Each bar represents the number of locations with a drive time within a certain time interval.
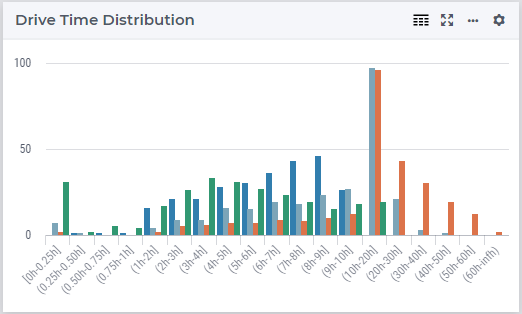
This figure shows the drive time distribution among four CoG results datasets.
Cost Breakdown
In this barchart you can see how the cost components relate to each other. The cost components are: Warehouse Fixed, Primary Transport, and Secondary Transport.
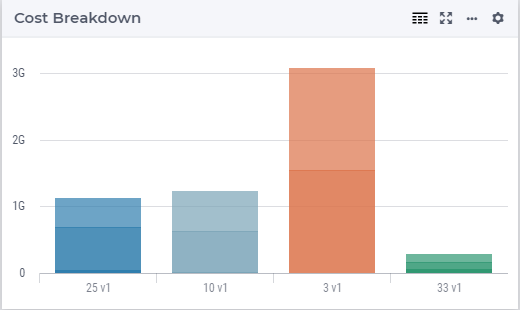
This figure shows the cost breakdown among four CoG results datasets.
CoG KPI Summary
Further solution details can be found on the CoG KPI Summary dialog, which can be opened using an icon on the status bar.
Here the following data is listed:
Number of CoGs
Primary Cost - the total transport cost from the suppliers to their distribution center(s) (CoGs)
Secondary Cost - the total transport cost from the distribution center(s) (CoGs) to their customers
Warehouse Running Cost - the cost for running all the DCs. This is equal to a scalar cost value times the number of DCs (Centers of Gravity).
Total Cost - the sum of all the cost components mentioned above
Average Drive Time - the average drive time from CoGs to the demand/supplier nodes
Max Drive Time - the maximum drive time from CoGs to demand/supplier nodes
# Locations Served - the total number of locations serviced by the center(s) of gravity
Volume Served - the total volume (load) which is serviced
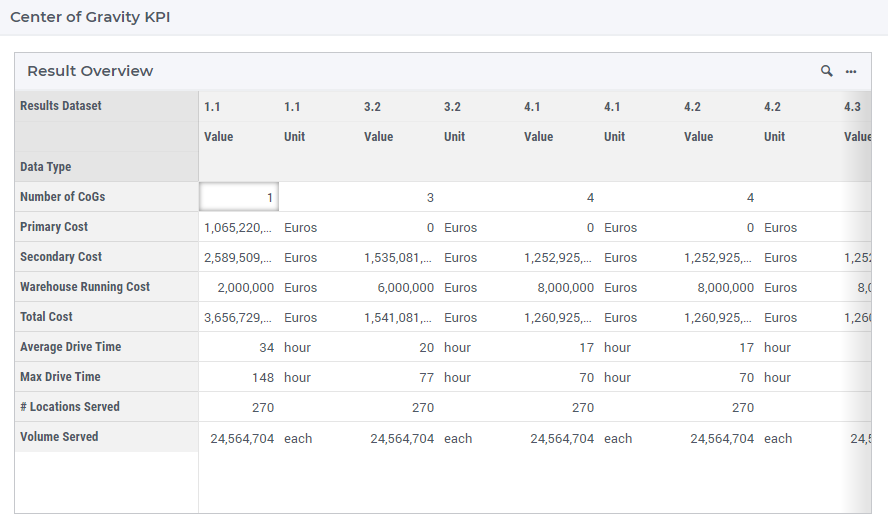
This figure shows the KPIs among four CoG results datasets. Each dataset has a Value column and a Unit column.
Save and Load CoG Results Data
Save CoG Results Data
You can save a CoG scenario by saving a CoG Results Data. Once the Center of Gravity locations have been generated, a page action  on the bottom right corner will appear to bring up the Save As CoG Result Data dialog.
Load CoG Results Data
You can compare multiple CoG scenarios by loading several CoG Results Data from the status bar CoG Results Data.
Only one active dataset can be selected.
Selecting a dataset for comparison is optional.
Once an active dataset is loaded, the check mark of the active dataset is removed from this dialog and the corresponding row becomes bold indicating its active status. You can add or remove compare datasets using ‘Select Compare’ column and keeping ‘Select Active’ column empty.
Note
The active CoG Results Data is shown at the status bar entry CoG Results. If a CoG analysis input is changed, such as Number of CoGs, Maximum Drive Time, and general settings and selected elements on CoG Settings page, status bar entry Result Data will display * in addition to the active CoG Result Data. For example  .
.