Customer Scenario

A Customer Scenario describes how customer related data, such as Demand, Lead Time, and Selling Price may change. On this page you can create and review such scenarios, so that they can be used in order to create a Network Scenario.

Every scenario on this page is described by the following:

  • Select Type: The left-hand part is meant for selecting the Customer, Location, and Product which you want to modify.

  • Select Attribute: The middle part enables you to select the attribute of data to be changed, for example, Demand, Lead Time, and Selling Price. In the table underneath you can make three types of changes for each period:

    • % Change: the relative increase (in percentage)

    • Value Increment: the absolute increase (in the original unit)

    • Value Overwrite: the new value to replace the original value

  • Changed Data The right-hand side table displays the resulting changes, color-coded along with tooltips for easy reference.

Next we discuss in turn each of these sections in more detail.

Select Type

On this page the "Type" refers to one of the options available in the drop-down list, which includes 'Customer', 'Location', and 'Product'. (these are the options used to defined the input data related to the customers). As you make selections in a combination of types, the available data will appear in the table on the right-hand side.

The choices in the selection widget underneath the type selection will be updated based on the selected type. For instance, when you switch the type from 'Customer' to 'Location', the selection widget underneath will also switch to the potential choices for 'Location'.

The "(x/y)" stands for: (the number of selected/the total number) in each type, which means x out of y are selected.

Once you have made selections in all three types, the data which are defined over 'Customer', 'Location', and 'Product' will be displayed in the table on the right-hand side.

The Customer, Location, and Product can be selected in these three widgets:

../../../_images/scenario_customer_selection1.png ../../../_images/scenario_customer_selection2.png ../../../_images/scenario_customer_selection3.png

Regarding groups in 'Customer', 'Location', and 'Product': choosing a group is equivalent to selecting all the corresponding individual elements within that group. The application stores the data for the elements which you select. For instance, if you select a location group (like Idaho in this example), the information will be stored like that. When this scenario is applied, it will be applied to all locations within the group Idaho simultaneously. This set of locations might be different (in another dataset) from the locations at the time this scenario was created.

Select Attribute

The drop-down list presents all attributes which can be potentially included in the customer input data. So, for instance, even if a particular input dataset does not include Lead Time, this (potential) attribute is still shown in the list.

../../../_images/scenario_customer_2.png

Below the attribute selection there is a table used for defining the values:

As mentioned above, there are three ways to make the change:

  • % Change: relative increase or decrease (in percentage); the range is from -100% to infinity.

  • Value Increment: increase or decrease by entering a positive or a negative number; there is no limit on this number.

  • Value Overwrite: the new value to replace the original value

Navigate among different ways of data change:

For one period, only one way of change can be applied and it is not possible to apply different changes to the same period. However, you can apply different changes to different periods.

Examples:

If % Change is made in period one, you can make an additional Value Increment in other period.
If % Change is made in period one, editing Value Increment also in period one will empty % Change in period one.
Period groups:
You can utilize period groups. Choosing a period group is equivalent to selecting all the periods within that group. Entering a value in an individual period will empty the value in the corresponding period group, and vice versa.

These changes are only applied to the selected combinations of Customer, Location, and Product.

Changed Data

Once you have specified all the modifications, you will see the changes applied to the current data in the table on the right-hand side. The data displayed in this table depends on both the selection of each type and the selected attribute.

  • Selection of each type

    • Customer input data is defined over all three types. Therefore, 'Customer', 'Product', and 'Location' must be selected.

    • If you only made selections in 'Customer' and 'Product', no data will appear, because there is no customer input data defined over only these two types.

  • Selected attribute

    By default, only the data corresponding to the selected attribute and the selection made in the types will be displayed. However, you can switch to displaying all available data by using the widget action located in the top right corner of the table.

You can use the page actions in order to save, create new, load, and apply the scenario data, see the section Scenario Page Actions for more details.

Examples

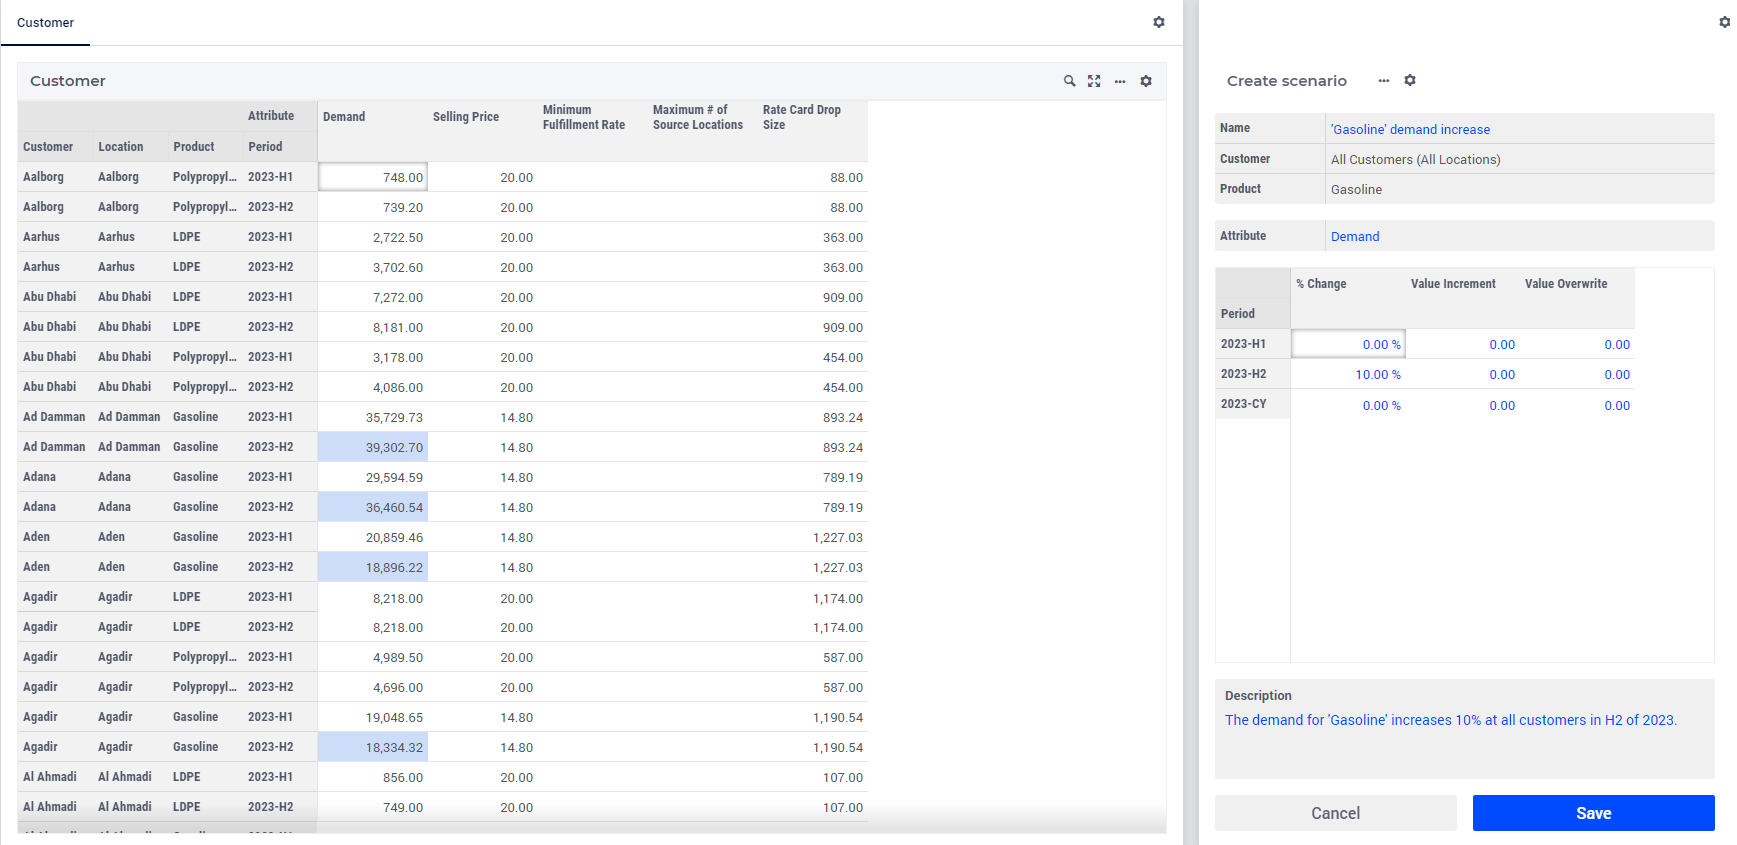
  • Scenario 1: 10% demand increase in a product for all customers in a location group

    Demand of product 'Gases' increases 10% in Q4 for all customers in the U.S.
    • Select Type 'Customer' and in the widget underneath, click on SELECT ALL

    • Select Type 'Location' and in the widget underneath, select 'US'

    • Select Type 'Product' and in the widget underneath, select 'Gases'

    • Select Attribute 'Demand' from the drop-down list and in the table underneath, enter the value 10 in the cell at the intersect of the row '% Change' and the period column '2022-4'.

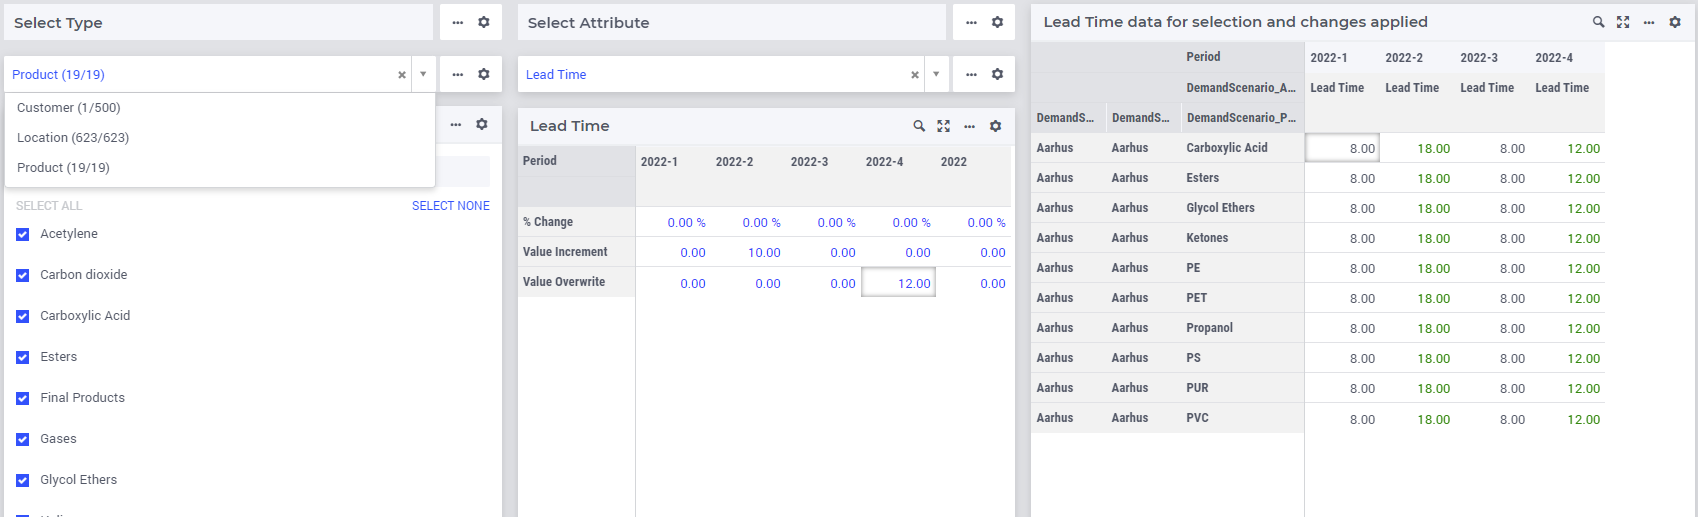
  • Scenario 2: the lead time for a customer increases to 10 in Q2 and to 12 in Q4

    • Select Type 'Customer' and in the widget underneath, click on SELECT ALL

    • Select Type 'Location' and in the widget underneath, select 'US'

    • Select Type 'Product' and in the widget underneath, click on SELECT ALL

    • Select Attribute 'Lead Time' from the drop-down list. In the table underneath, enter the value 10 in the cell at the intersect of the row 'Value Increment' and period column '2022-2'. Similarly, enter the value 12 in the cell at the intersect of the row 'Value Overwrite' and the period column '2022-4'.

../../../_images/scenario_customer_example2.png