CoG Trade-Off
This page explains how to use the Center of Gravity Trade-Off Analysis functionality in the SC Navigator. This feature allows the user to examine how the final results, such as the total costs, are affected by changing one parameter in the model. For example, you can examine the total cost for different number of CoG’s by using the chart on this page. Moreover, it is also possible to find the so-called sweet spots when comparing two objectives.
How to use this functionality
Center of Gravity Trade-Off Analysis involves running multiple results in which a predefined parameter is varied within a specified range. Based on the optimized results obtained for each value, we can perform comparisons and examine the impact of the parameter on the model. This analysis consists of the following steps.
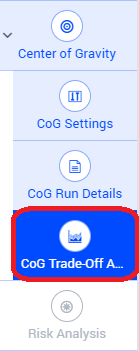
After opening the SC Navigator app and loading the input data which you want to examine, you can open the Center of Gravity Trade-Off Analysis page from the Center of Gravity sub-menu in the workflow.
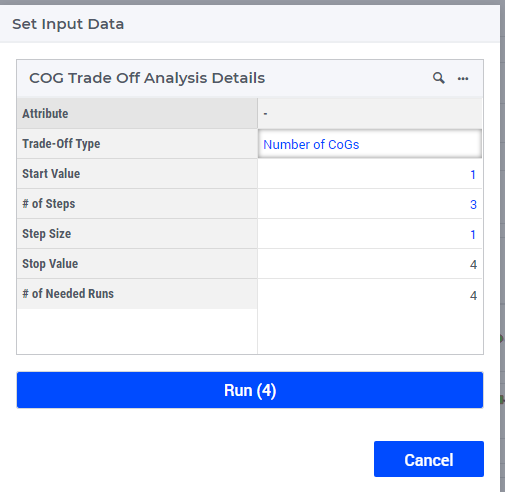
When you open this page and no Trade-Off Analysis input data has been provided, a dialog page will show up.
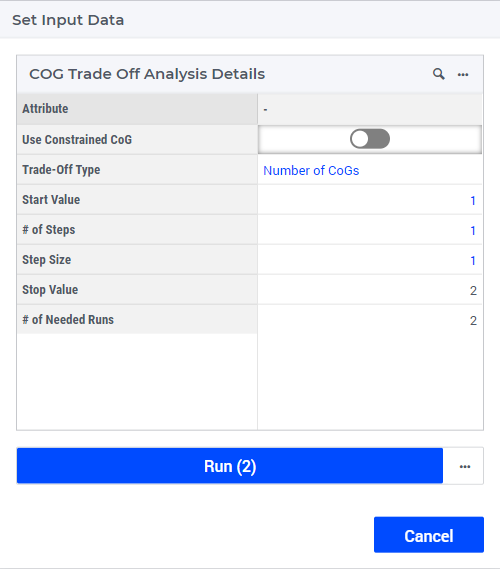
The settings in this dialog determines the model that will be solved, as well as how many of them. The first two settings determine the mode/model that will be solved, as follows:
Use Constrained CoG/Trade-Off Type |
Number of CoGs |
Max Drive Time |
|---|---|---|
No, don’t use constraint CoG |
The Number of CoGs model will be used. |
The Max Drive Time model will be used. |
Yes, use constraint CoG |
Constrained CoG, with Minimum Number of New CoGs and Maximum Number of New CoGs equal to the Number of CoGs. |
Constrained CoG, with Maximum Drive Time in table ‘Constrained CoG’ equal to Max Drive Time. |
For all the other settings, they current values on page Center of Gravity and CoG Settings are used.
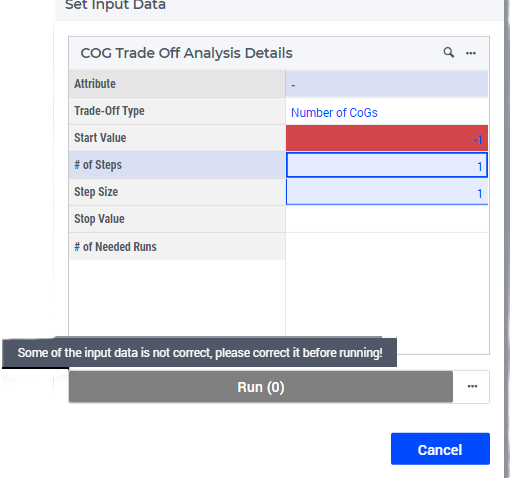
Once all the input data is properly specified, the run button will be come active. If any of the input data is not correct, the cell of the wrong data will be highlighted in red and the Run button will be inactive and when hovering on the button a tooltip will show up.
3. After defining all the input data correctly, you can click on the Run button. The number on the button shows how many jobs will be run. Or, if you want to run the analysis later, you can close the dialog page by clicking on the Cancel button. In this case the defined data will be deleted and the default data or previously solved will be visible when you reopen the page.
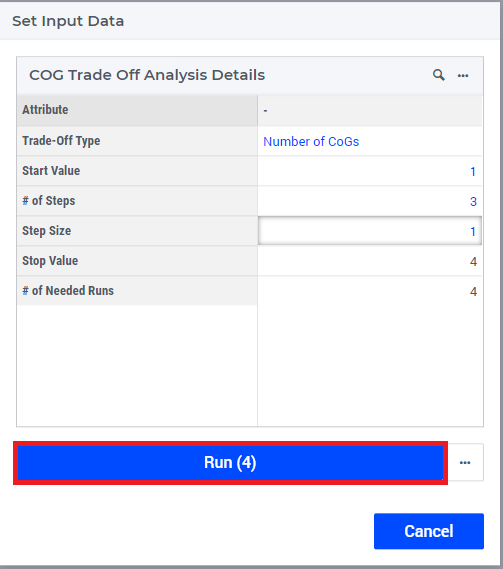
In the example above, the number of CoGs will be different in each of the four jobs. The number of CoGs will vary from 1 to 4 with a step size of 1. This results in four runs/jobs, where the Number of CoGs will be 1, 2, 3 and 4, respectively.
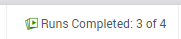
After clicking the Run button and running the jobs has been started, you can track how many results have been finished, so far, by inspecting the information on the status bar as well as in the title of Center of Gravity Trade-Off Analysis chart. The status bar looks like this:
While the header of the Center of Gravity Trade-Off Analysis Chart looks like this:

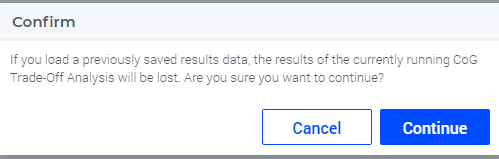
Moreover, on the Center of Gravity Trade-Off Analysis page the points representing the completed results are displayed on the chart. After starting the jobs you can navigate through the application, but if you want to load a new dataset or load the results of a previously saved CoG Trade-Off the following warning message will appear and warn you that the results of the currently running jobs will be lost.
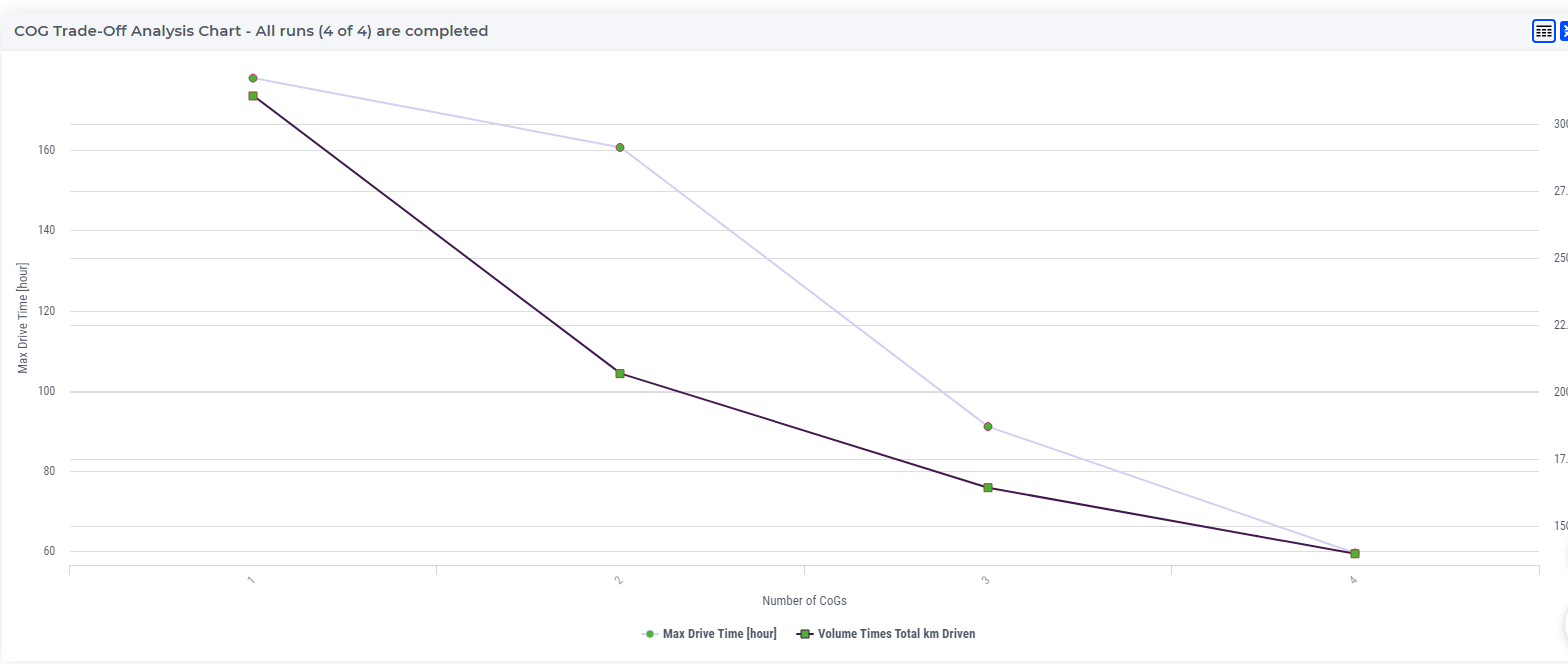
After all runs have been finished, the chart will display as many points as the total number of results run during the analysis.
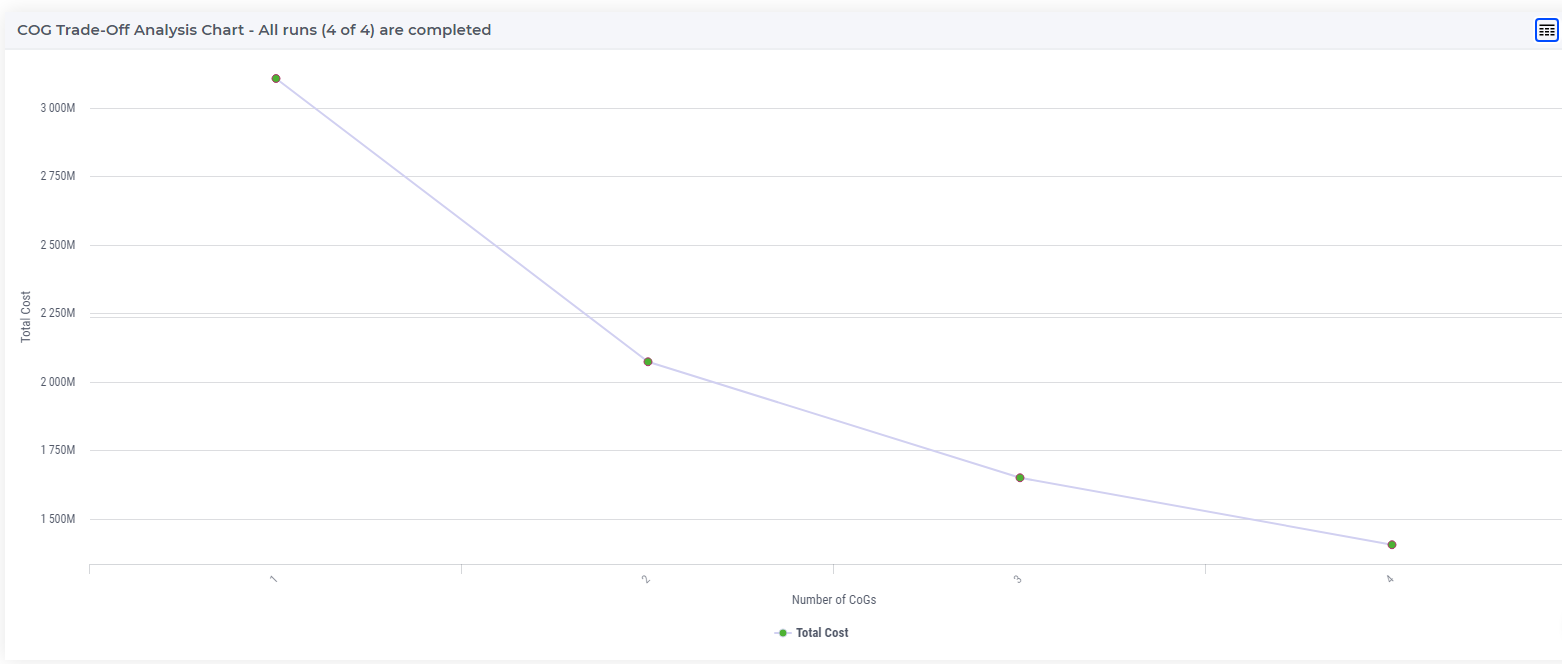
By default, the y-axis displays the Total Cost if the selected model objective is Minimize Cost and in all other cases it displays the Profit. However, this can be changed by clicking on the widget actions icon and selecting Set Y Axis For Chart on the chart. Moreover, you can also configure what the secondary y-axis should display.
For example, if you select the secondary y-axis to show the Volume Times Total Miles Driven, then the chart will look as follows:
If you wish to examine one of the resulting datasets, you can load the result dataset by right-clicking on the result point on the chart, which can be associated either with the primary y-axis value or with the secondary y-axis value.
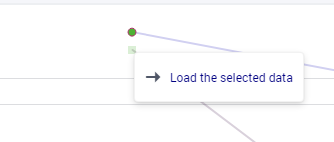
When you load the selected result dataset, you can see the results of the optimization in the same way as when you load some Results data.
If you want to open the input data you should click on the Setup and Run button.
If you want to change the input data and run a new CoG Trade-off Analysis, you can do it by clicking on the Setup and Run button or create a new Center of Gravity Trade-Off Analysis, as described in section 9.
If you want to display the created Center of Gravity Trade-Off Analysis results on Map you can click on the page action icon
 and select Show Results on Map.
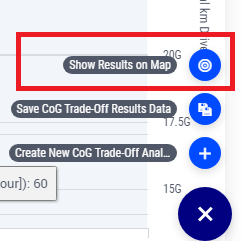
In this case a dialog page will pop up where you can select the Center of Gravity Trade-Off Analysis results which you want to display.
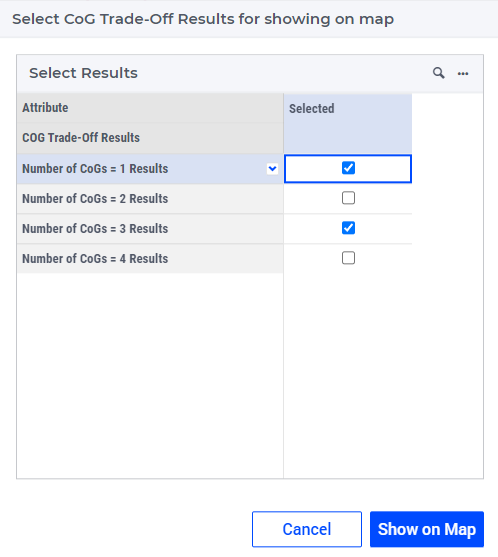
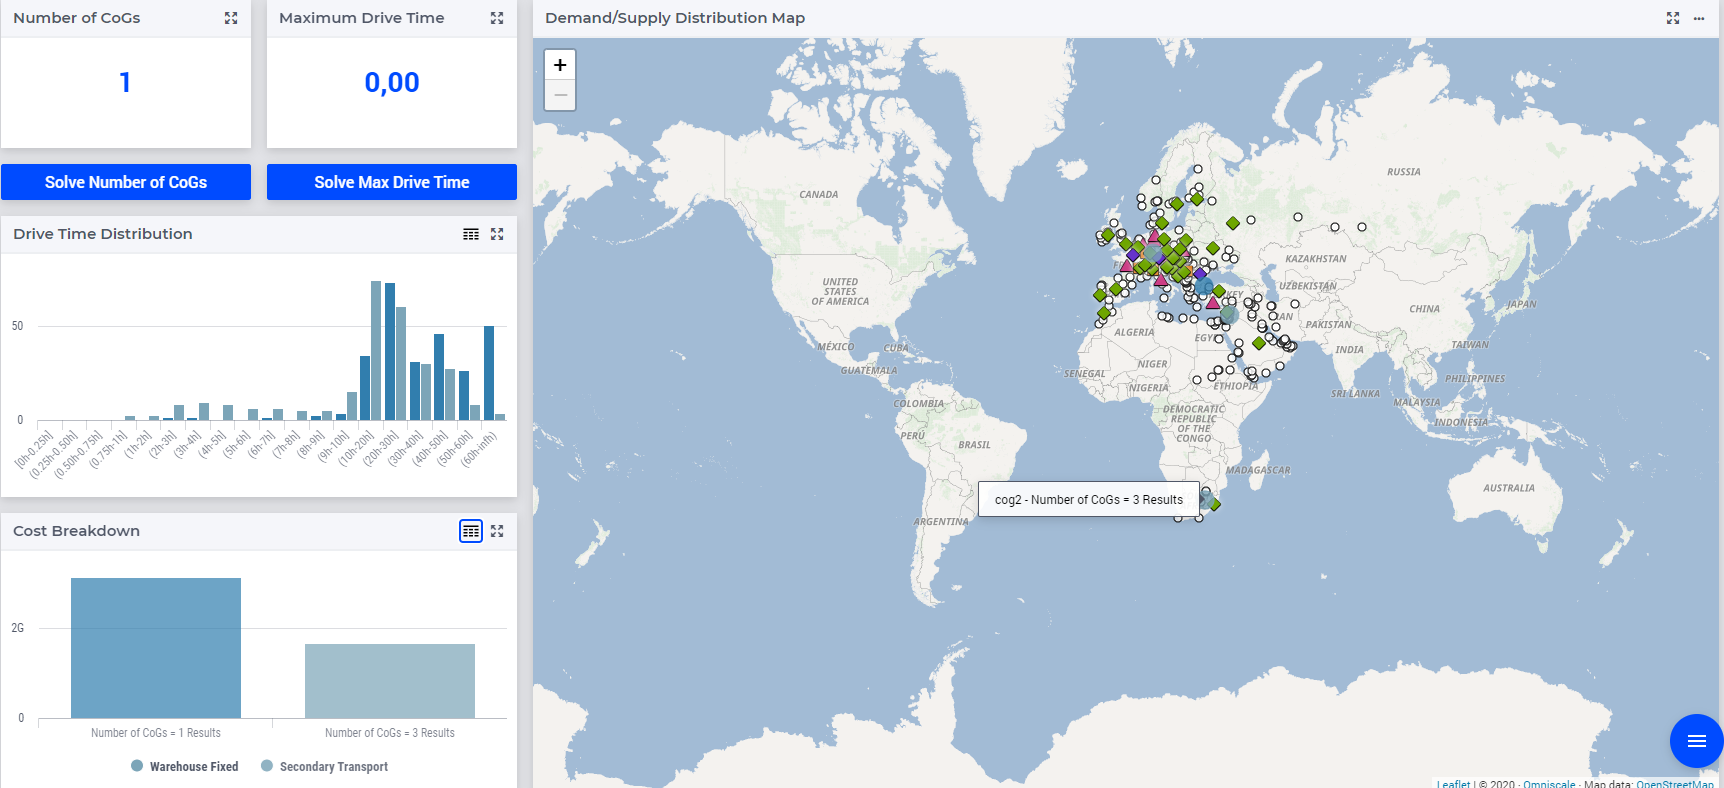
After clicking on the button Show on Map, the selected results will appear on the map and on the charts:
If you wish to save the created Center of Gravity Trade-Off Analysis you can click on the page action icon
and select Save As CoG Trade-Off Analysis Results Data.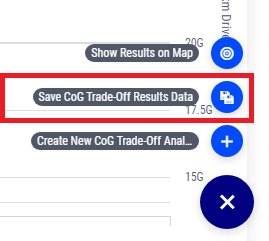
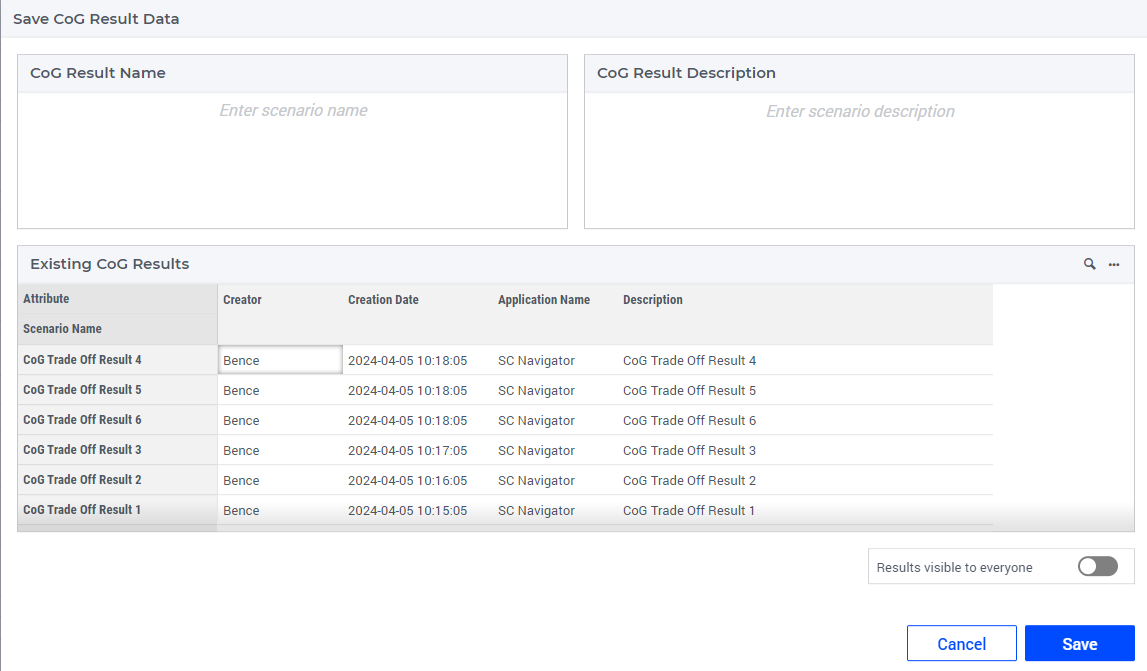
In this case a dialog page will show up on which you can provide a name and some description for the Center of Gravity Trade-Off Analysis result to be saved.
If you want to create a new Center of Gravity Trade-Off Analysis result, you can click on the page action icon
and select Create new CoG Trade-Off Analysis.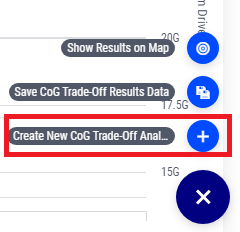
In this case the Input Data dialog page will show up where a new results can be created as already explained above.
Load Center of Gravity Trade-Off Analysis data
Besides loading the data for a single result you can also load the data from a previously conducted analysis, meaning only the data on the Center of Gravity Trade-Off Analysis page, that is, the chart and its corresponding input data. You can open the list of the saved Center of Gravity Trade-Off Analyses on the CoG Trade-Off Analysis page by clicking on the CoG Trade-Off Analysis Results button on the status bar.
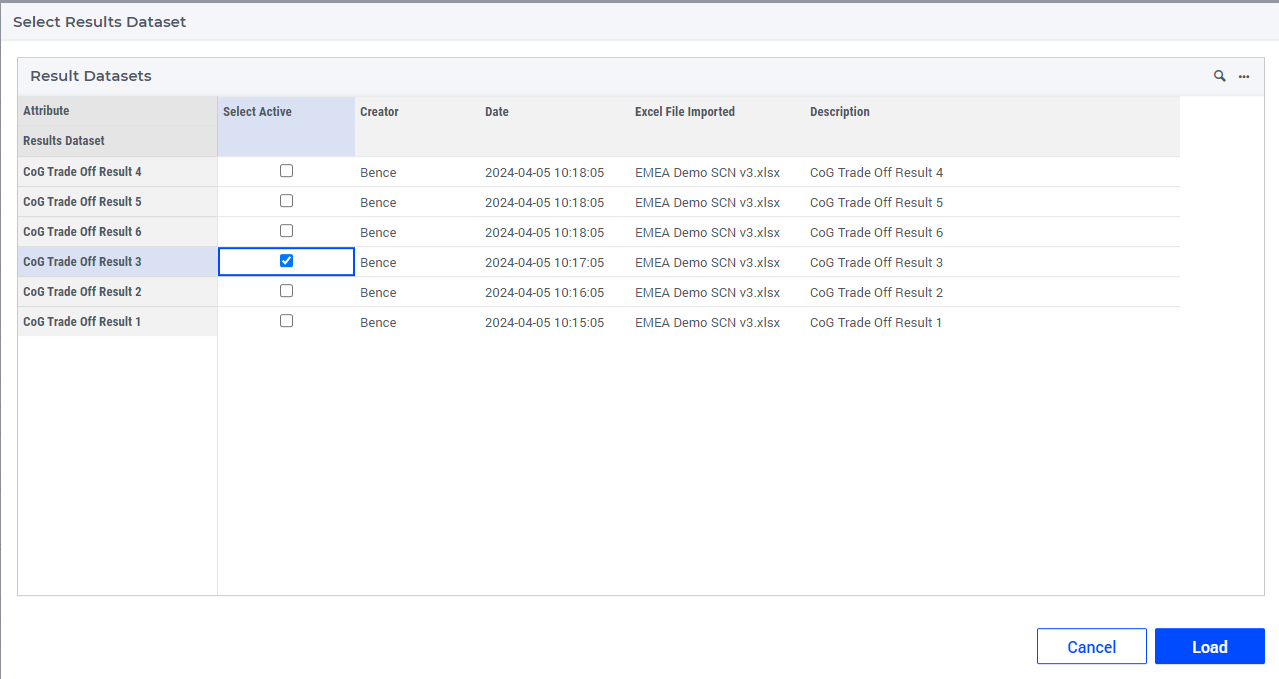
After clicking on the Load CoG Trade-Off Analysis Data, a dialog page will show up where you can select which Center of Gravity Trade-Off Analysis data you want to load.
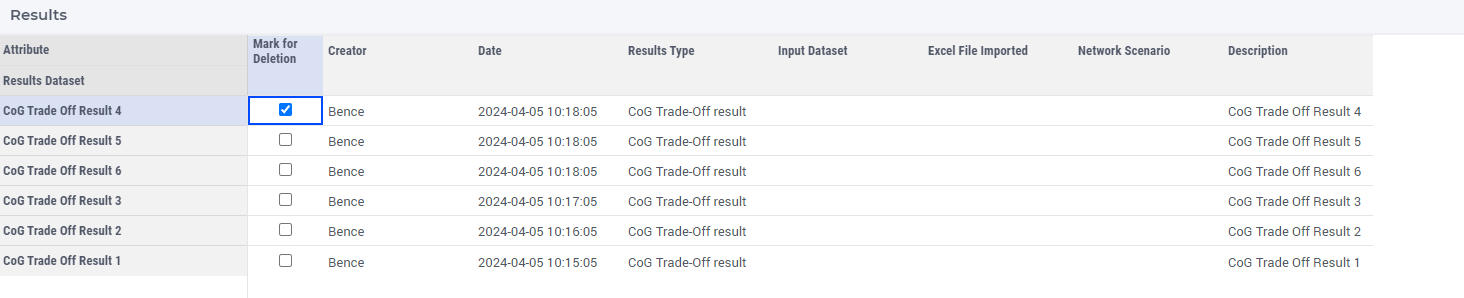
Delete Trade-Off Analysis data
On the Data Management page you can delete Center of Gravity Trade-Off Analysis results, just like any other data. You can read more about deleting data in the section Manage Data.
Select the Center of Gravity Trade-Off Analysis result dataset you want to delete by ticking the corresponding checkbox in the Mark for Deletion column in the Results Table.
Once you have selected the rows you want to delete, you can then proceed with their deletion by clicking on the page action.
Note
When you delete a Center of Gravity Trade-Off Analysis result dataset, all the created case files related to the deleted Center of Gravity Trade-Off Analysis will be deleted as well. When you want to keep any of those, you either have to save it as another results dataset, or keep the complete analysis.