Cost To Serve Results
This page shows more details about the costs shown on the KPI Overview page. More specifically, it provides a clearer picture of the different types of costs related to demand. The page shows the breakdown of the various cost components to fulfill the demand. On this page, we can find information about the cost of fulfilling each customers’ demand. The cost is broken down into components like variable and fixed cost and is categorized into five different groups: Customer, Supply, Production, Warehouse, and Transport.
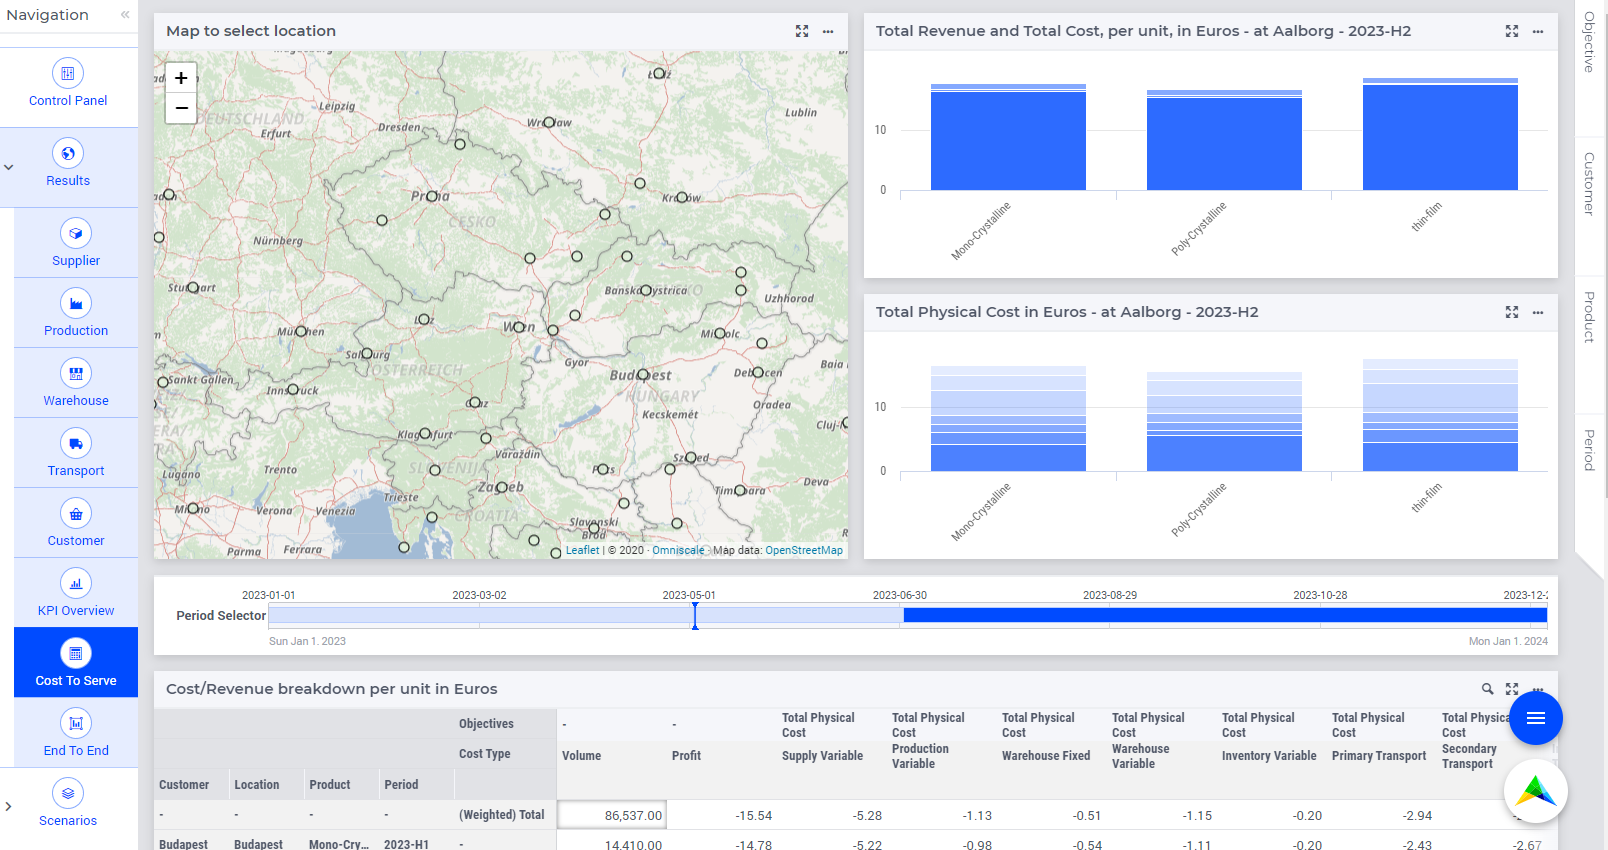
You can read about the period selector in Period Selector. Note that the customer nodes are hidden by default when more than 2500 customer locations are present. To toggle the visibility of customer nodes, navigate to the Customer side panel and click on the Show Customers on Map switch.
The node colors are determined in the following way:
The currently selected node is orange
A customer node with unmet demand is red
A customer node with smaller revenue than expenses is yellow
A customer node which is supplied and profitable is white
Non-customer nodes are gray
Location selection
Select a location by clicking on the corresponding node on the map. In that case, the cost charts will show the data for the selected location.
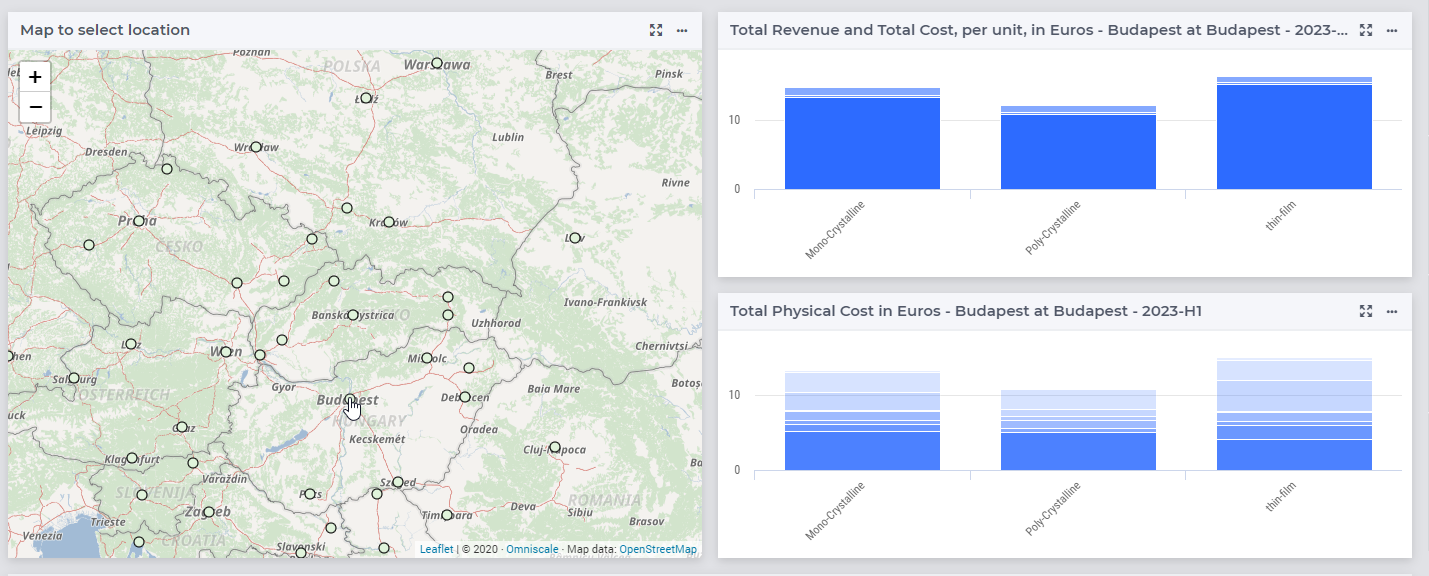
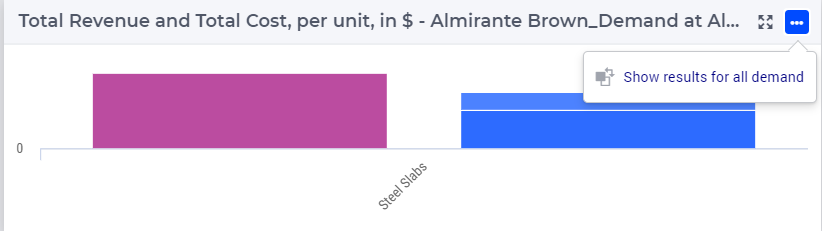
Total Revenue and Total Cost
This bar chart shows the breakdown of the total revenue and the total cost per unit to deliver to the selected location.
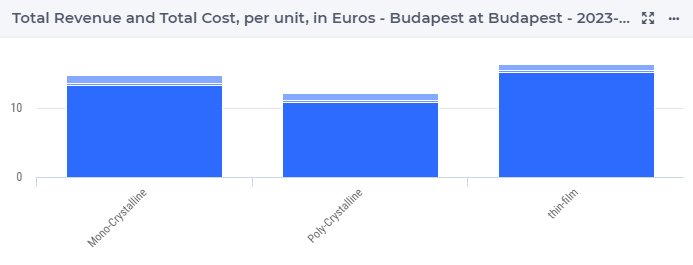
The selected location is shown in the title bar. The tooltips on this chart also provide more detailed information about the product, the objective, and the total revenue.
You can toggle between the breakdown cost per unit and the results for the total demand on the top right corner of the chart.
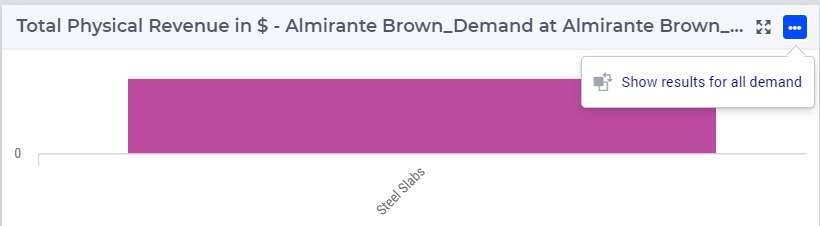
The selected location and the currently selected period is shown in the title bar. The tooltips on this chart also provide more detailed information about the product, the cost type, and the total cost. You can toggle between the breakdown cost per unit and the results for the total demand on the top right corner of the chart.
Right-hand side filter menu
Objective Filter
This side panel contains the objectives related to costs and revenue.
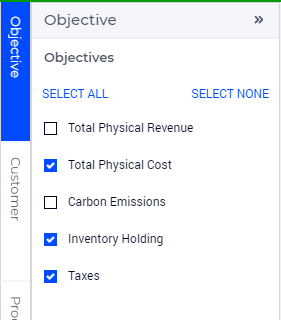
Use the checkboxes to filter by Objectives. In that case, only the data of the selected objectives will be displayed on the page.
Cost/Revenue Breakdown Table
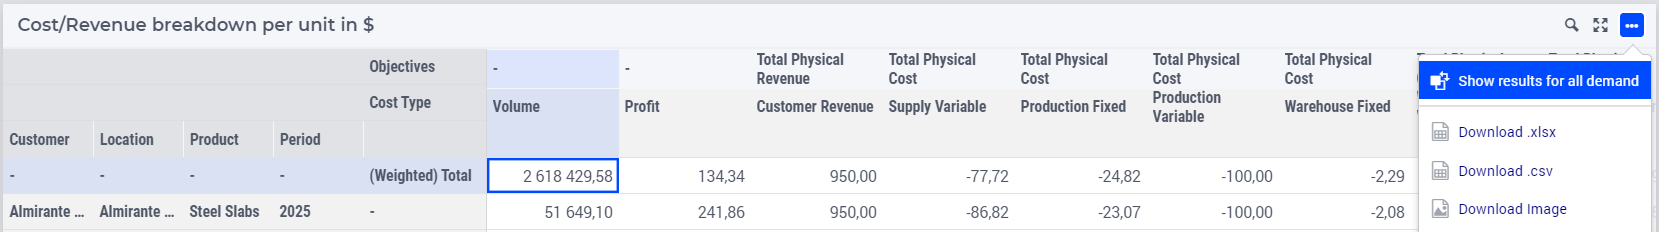
This table contains the cost/revenue breakdown for all customers per product and per period.
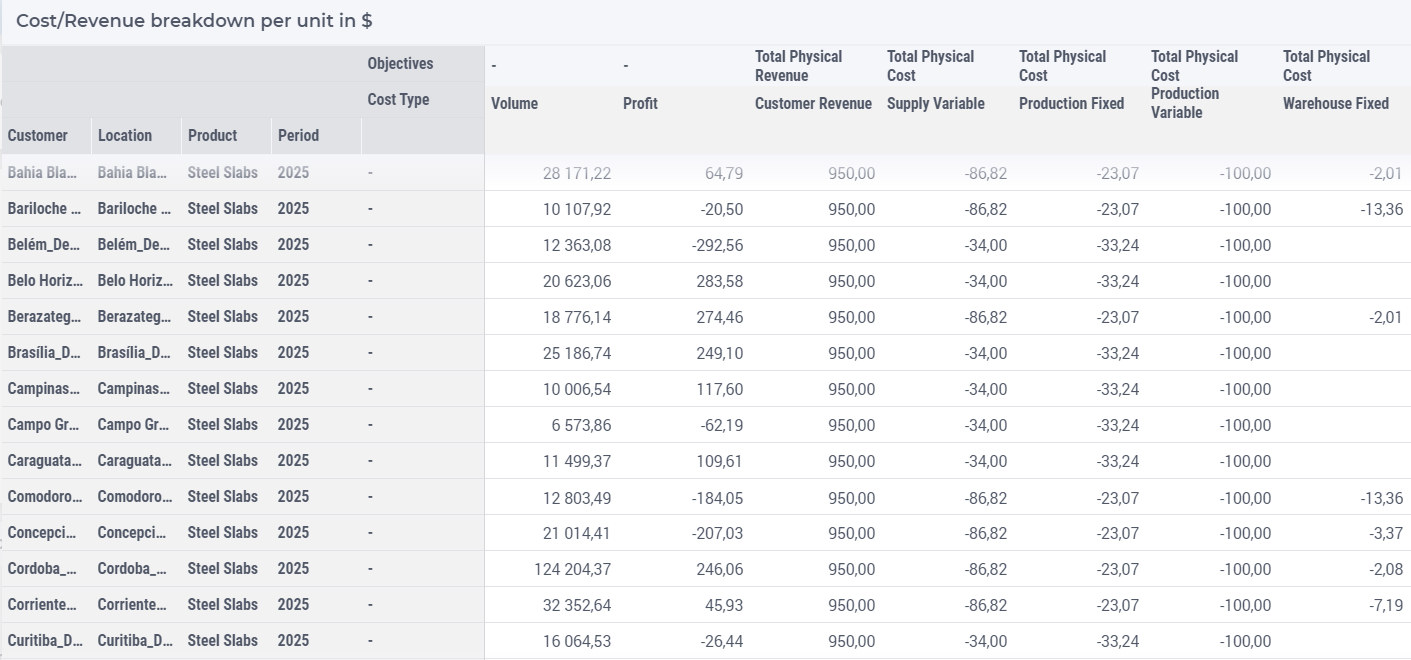
More specifically, the table shows details about the volume, the profit, and the total costs/revenue and the custom objectives for the different cost types.
You can switch to show details for all demand by clicking on the icon  on the right corner of the table.
Objective Breakdown Table
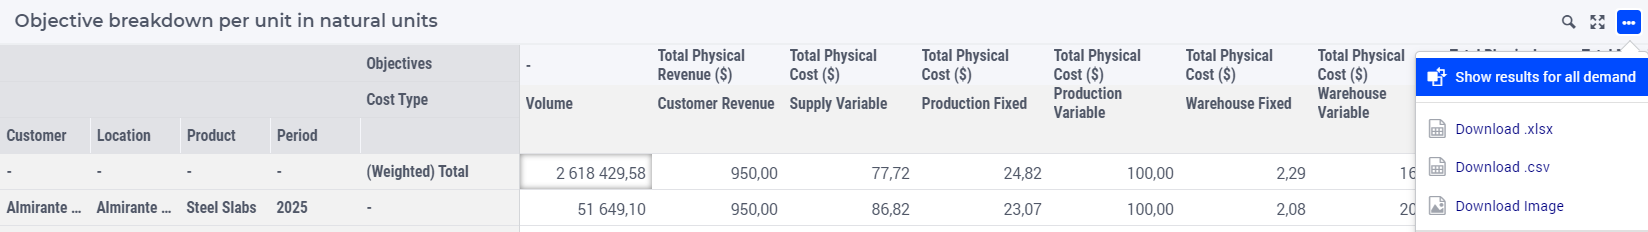
This table contains the objective breakdown per unit in the natural unit of measurement.
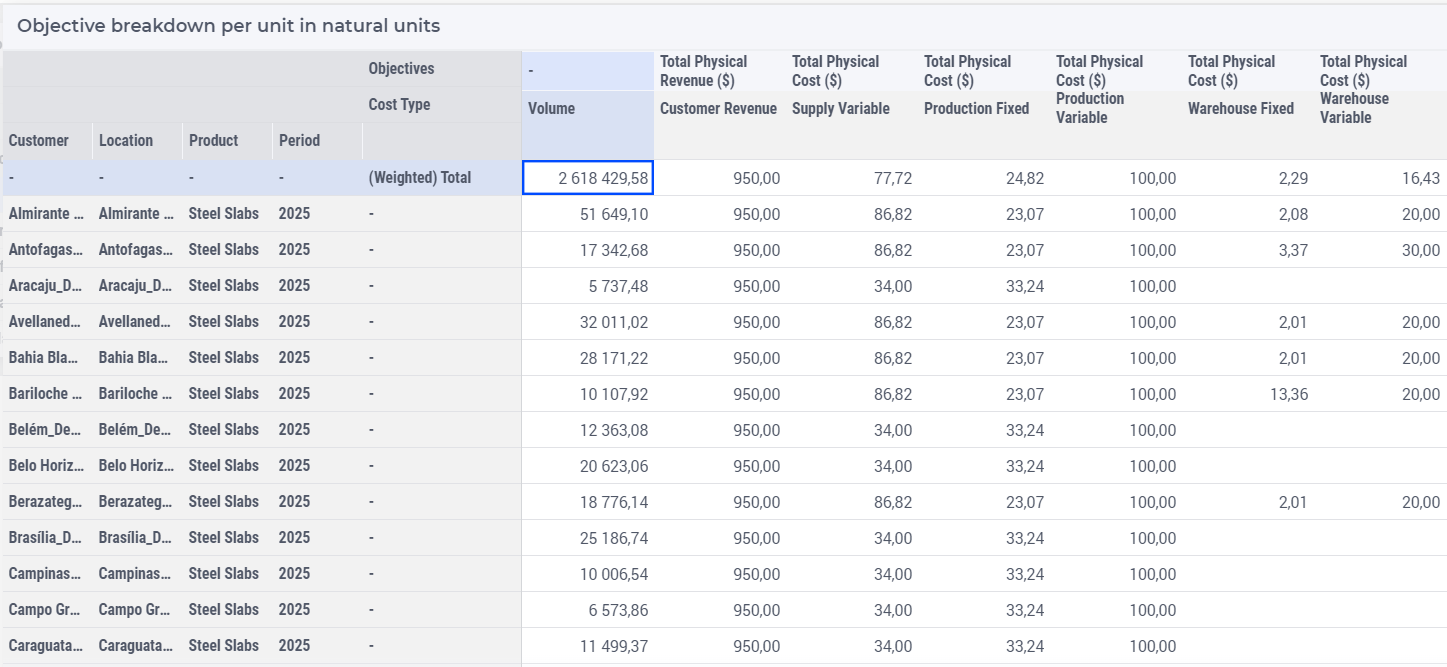
The table shows details about the volume, the profit, and the total costs/revenue and the custom objectives for the different cost types.
You can switch to show details for all demand by clicking on the icon on the right corner of the table.
System Cost Breakdown Table
The Cost to Serve costs assign the supply chain costs to the demand. However, there are some costs that cannot be directly attributed to demand. These costs become System Cost in the Cost To Serve and End To End results. The model contains the following sources of System Cost:
Closing Costs
Fixed and Opening Costs, when there is no supply/production/throughput
Target Inventory Violation Costs, when there is no inventory
Inventory Costs and the supply chain costs when there is no outflow
The first three costs are cost related to zero flow and therefore it cannot be attributed to any demand. In the model, this cost is equally attributed to all demand or to all demand for one specific product in case of product specific cost. For instance, if there is a product specific fixed cost with zero flow, that cost is attributed to the demand of that product only.
In case of multiple periods with inventory, the Cost To Serve does not assign costs across periods. So, the cost in period N is assigned to the demand in period N. However, this means that if there is no outflow from a warehouse in a period, the cost from supply to inventory can not be attributed to any demand. This becomes system costs and we attribute that over the demand as follows:
If there is demand for this product in this period, it will be attributed to that demand.
If there is demand for this product but not in this period, it will be attributed to the demand for this product in all periods.
If there is no demand for this product, it will be attributed to the demand for all products in all periods.
System cost is divided into four categories:
Supply System Cost, containing system cost derived from Supplier Fixed Cost, and Supplier Variable Cost.
Production System Cost, containing system cost derived from Production Fixed Cost, and Production Variable Cost.
Warehouse System Cost, containing system cost derived from Warehouse Fixed Cost, Warehouse Variable Cost, and Inventory related costs.
Transport System Cost, containing system cost derived from Transport related costs.
The tooltip in table Cost/Revenue Breakdown Table shows how the system cost is spread over the demand, as you can see here:
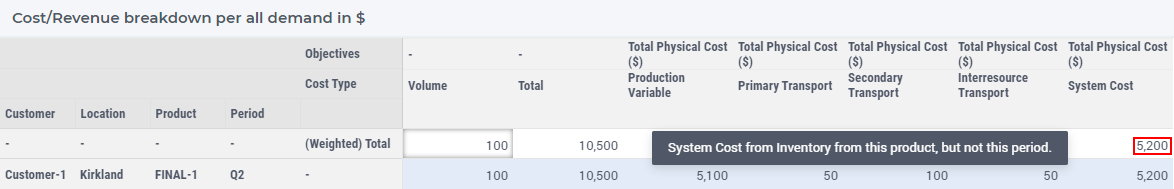
In many cases, this is a relative small cost, but for the inventory, this can be substantial. Therefore, we have created a table that shows the source of this data. This table is only visible if we have these costs.
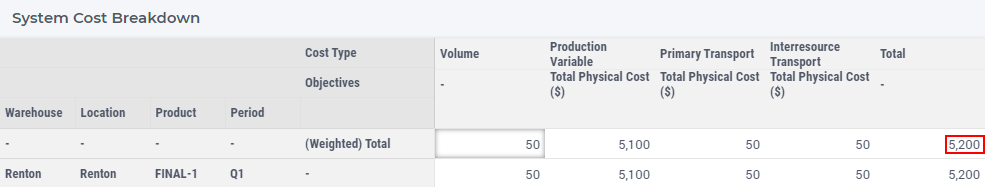
This table only shows the total and never the per unit cost. The product and period filter on this page also work for this table, but in that case the totals do not have to match, due to the logic about how this is spread. The two totals that should be compared are marked with red. The volume in this table is the amount of inventory in that period.