Infeasibility Analysis
This section explains how the page Infeasibility Analysis works in the application. This page becomes visible in the workflow only if you clicked on the Optimize button but the model cannot be solved. In this case, the page Infeasibility Analysis helps you understand why the model became infeasible. Note that, for the model to become infeasible the constraint that all demand is met must be violated.
The infeasibility analysis is carried out by relaxing different constraints in the model and by putting some penalties on their violations. These can be set in the ‘Violations’ table to one of the values ‘Low’, ‘Medium’, or ‘High’, or to none (it is set to none by default for all penalties except the Demand Penalty). In order to reset a penalty to none you can press delete. Please note that you can set all penalties at once by using block editing.
Playing with these penalty levels can be insightful when more than one constraint is violated, especially if you suspect that the root causes of these violations are the same. If the relaxed model becomes feasible, analyzing the sensitivity to changes in each constraint of the relaxed model allows the software to determine what the cause of the infeasibility may be. However, note that, if only some (or in some edge cases even all) penalties are set it is not guaranteed that by relaxing this set of constraints the model becomes feasible. So, in this case one has to experiment by setting more penalties.
Quick Start Guide
Imagine the situation when the entered demand for a product is higher than the supply for that product in the input dataset. This means that the demand for a particular product summed over all customers exceeds the supply for that product summed over all suppliers. In this case, there is no feasible solution which stays within the bounds of the maximum available supply and meets all the required demand.
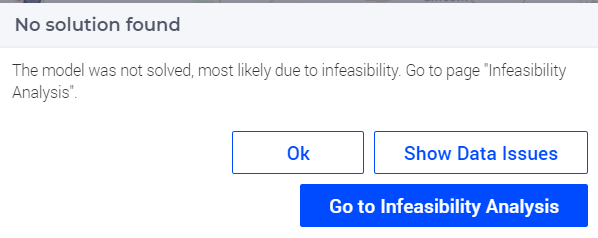
When the solver detects such an infeasibility problem, a warning message is displayed. In this case, you can choose to go to the Infeasibility Analysis page for help in finding the causes of infeasibility.
At this stage the Infeasibility Analysis step becomes visible in the Workflow menu and you can navigate to the page:
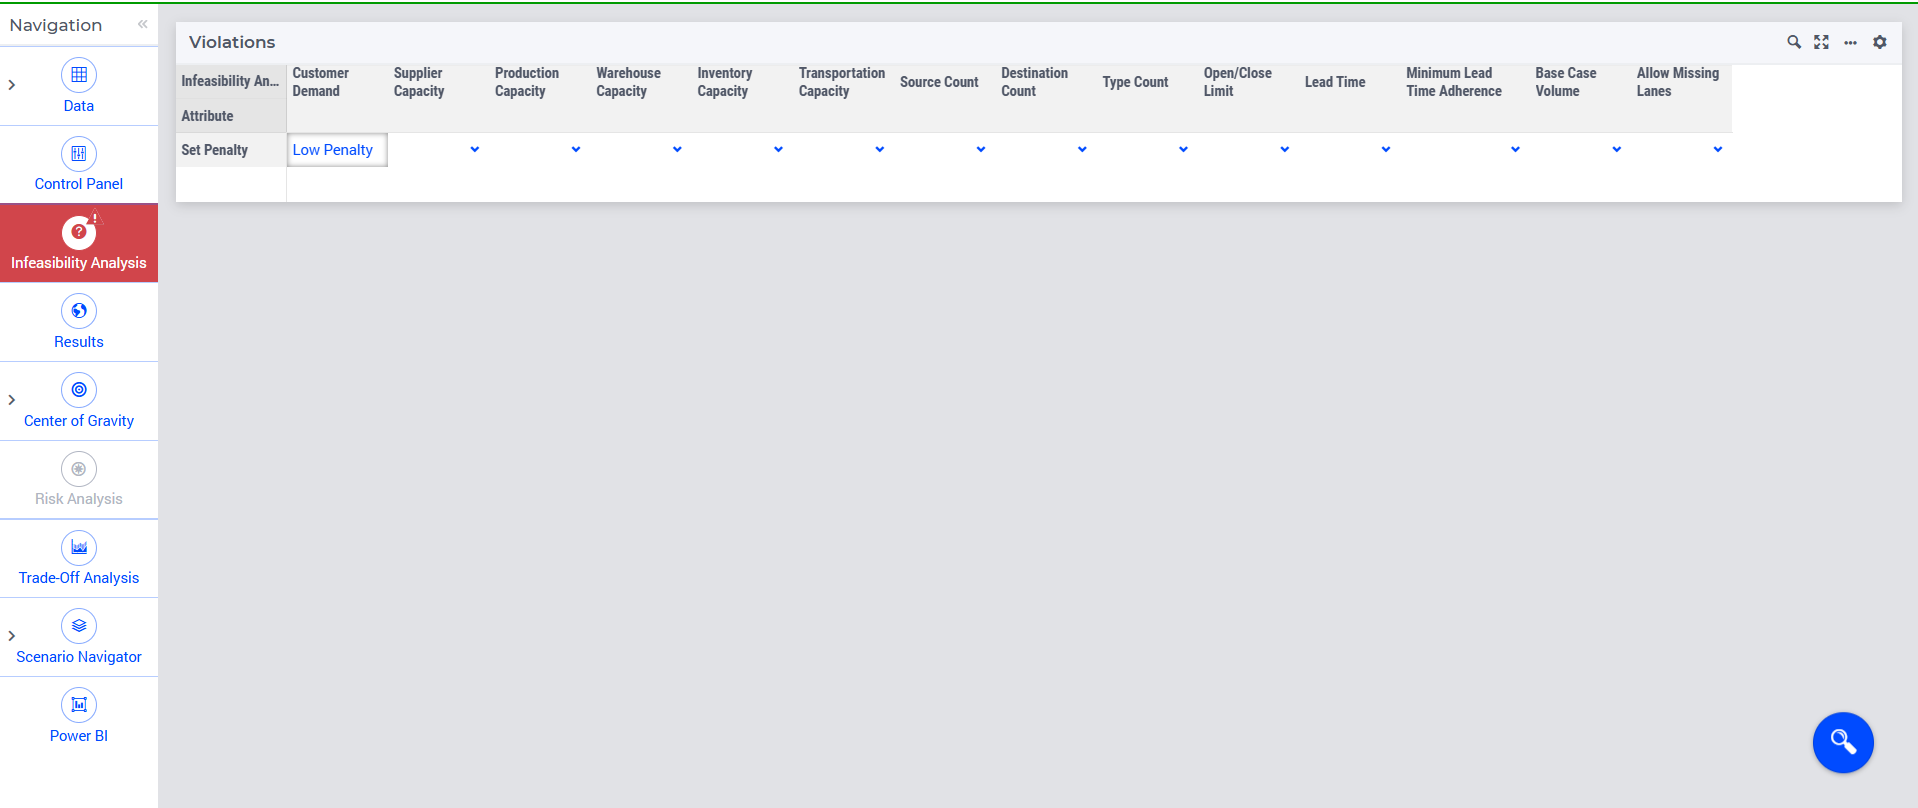
In the example at hand the customer demand is violated, but at this point it is not yet clear which Customer and Product element combinations are problematic.
Firstly, we run the relaxed model with the default penalty settings by clicking on the primary page action  in the bottom right corner of the page.
If the relaxed model can now be solved, then a table will show the results of this analysis.
in the bottom right corner of the page.
If the relaxed model can now be solved, then a table will show the results of this analysis.
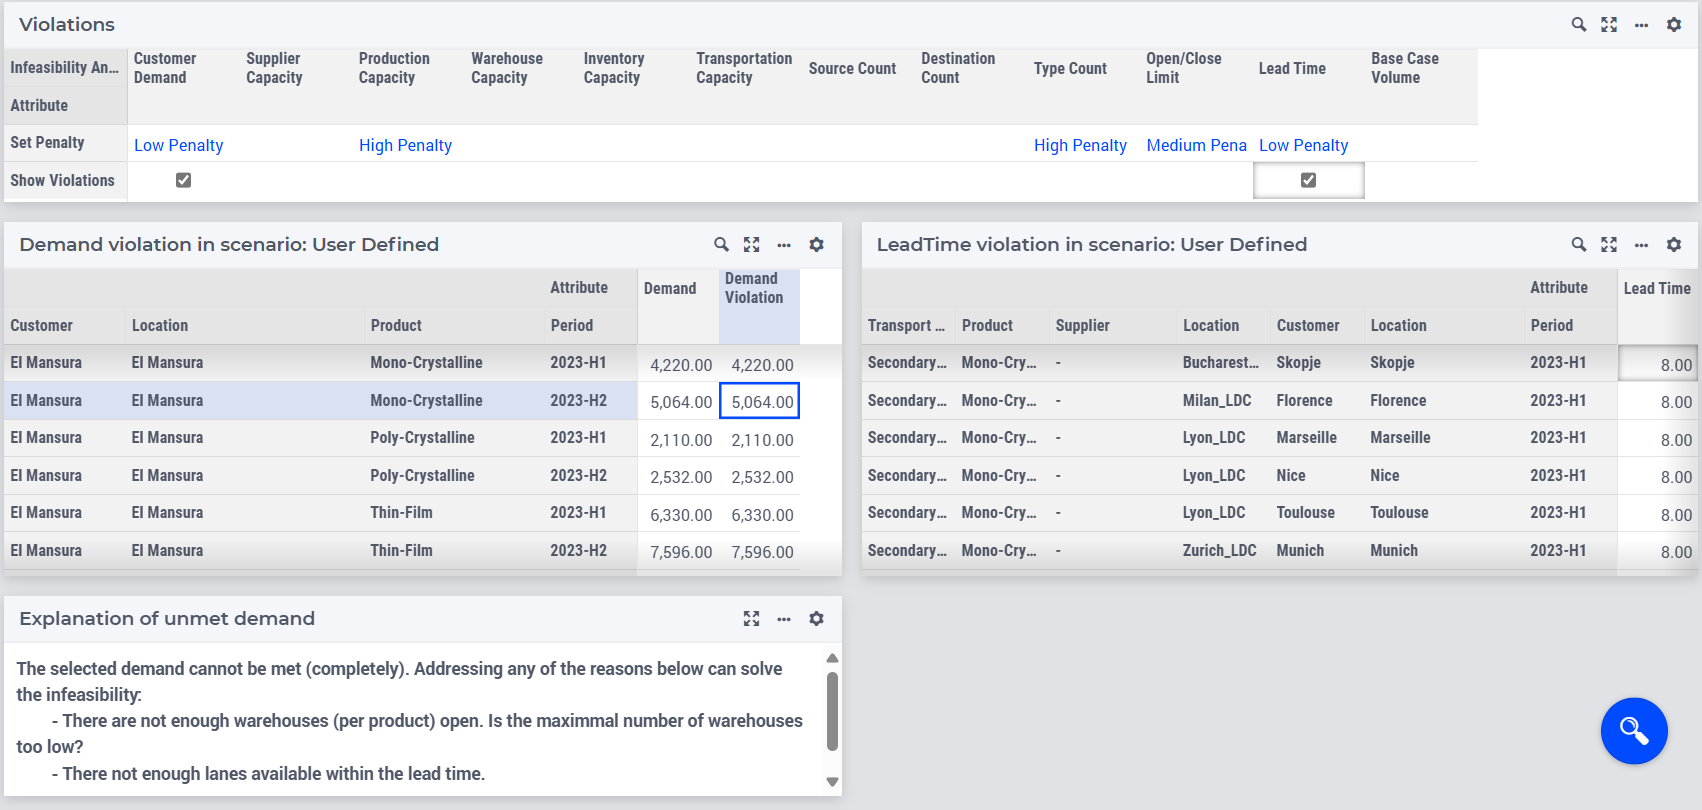
In this example the relaxed model is feasible, the table ‘Demand Violation’ becomes visible and shows the Customer, Location, Product, and Period element combinations which caused the infeasibility.
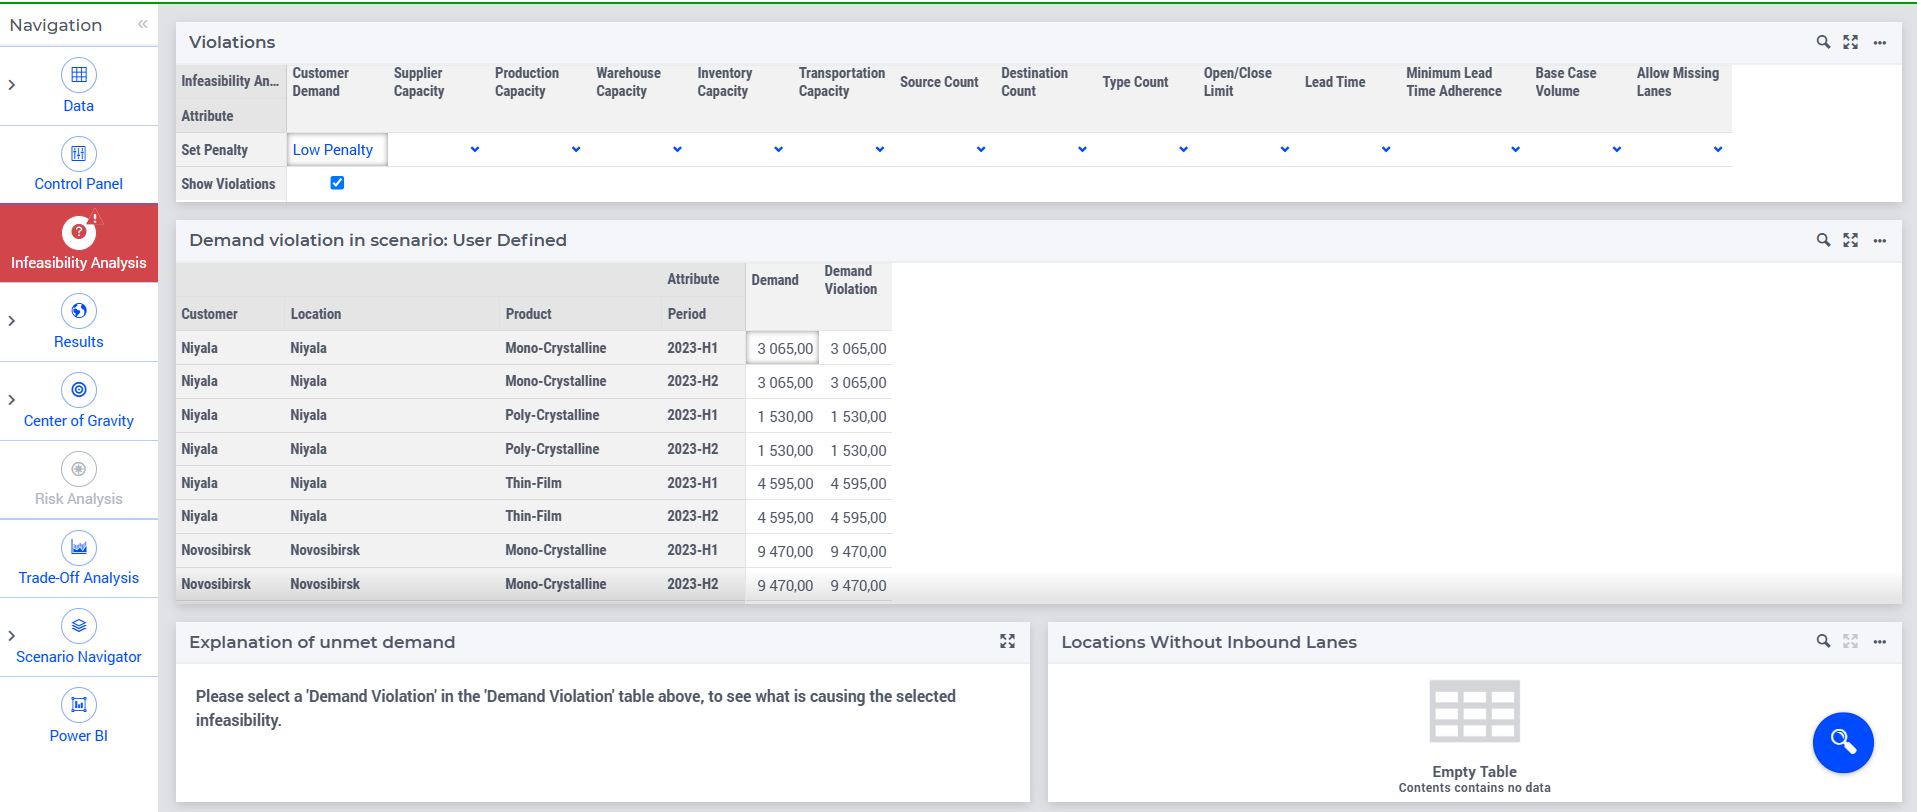
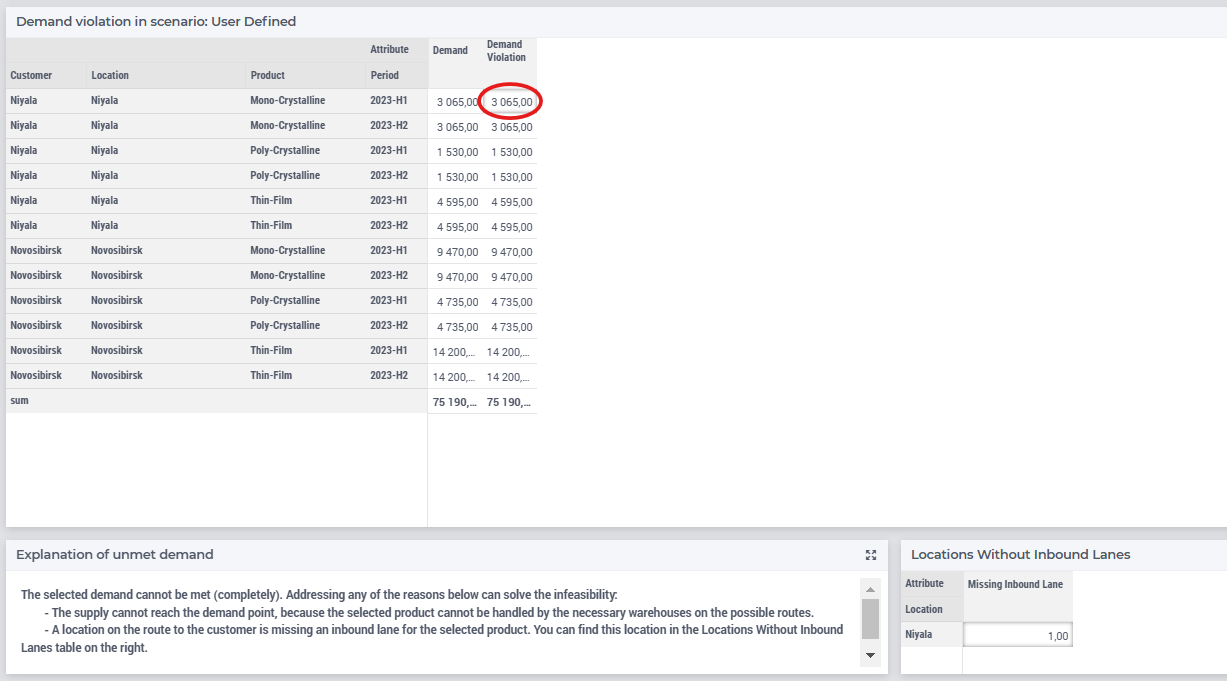
If you click on a cell in the violation column in the table ‘Demand Violation’, the table ‘Explanation of unmet demand’ will show why the customer demand cannot be fulfilled.
User Interface Overview
Here is an example for how all the UI elements look after a feasible run of the selected model:
- Settings
- As already mentioned above, the ‘Violations’ table is used for setting the penalties for the different constraints which we want to relax in the infeasibility analysis. After running the relaxed model (which turns out feasible), the two widgets in the middle of the page will show a tab for those constraints which are violated in the solution (‘Demand Details’ and ‘Source Customer Details’ in the example page above). You can decide which tabs containing the summary of the violations for the corresponding constraint you want to display. This way the UI is not cluttered with all these tables at the same time.
- “Violations in scenario” tables
- The names of the tables on the aforementioned tabs contain “violations in scenario” and they are the aforementioned tables summarizing the different violations for the different constraints. As mentioned before, when selecting a Customer, Location, Product, and Period element combination the explanation for the unmet demand of that selection will appear. To interpret such explanations please see the section Troubleshooting Scenarios.
- Explanation tables
- The ‘Explanation of unmet demand’ table explains what is causing the violation of the unmet demand. This is based on the sensitivity analysis mentioned in the section Quick Start Guide. Among others, potential causes can be that not enough Suppliers are connected to the given Customer or that the maximum capacity constraints being violated. For more information please see the section Troubleshooting Scenarios.
- Primary page action
- The primary page action of this page runs the infeasibility analysis and is always available.
Troubleshooting Scenarios
When interpreting the explanations and attempting to troubleshoot the infeasibility it is important to understand that, while these explanations provide valuable guidelines, they are not necessarily a simple guaranteed solution for quickly resolving the infeasibility. While the software relies on the information returned by the mathematical program, interpreting this information is rarely an easy task and is difficult to achieve algorithmically. Often there are alternative explanations offered and mathematically both might resolve the infeasibility.
Another nuance is that for each type of constraint we refer to on this page, usually we mean multiple individual constraints which are generated in the model. For example, the violation of ‘Supplier Capacity’ might be a violation of a capacity for an individual product or the capacity of the supplier in aggregate.
Another important note is that troubleshooting becomes much more nuanced if minimum capacities are also considered. So, try relaxing all minimal capacities and troubleshoot with these relaxed first. If the problem is actually caused by the minimal capacities (that is, the model becomes feasible after relaxing all the minimal capacity constraints), then you can use the Infeasibility Analysis by putting these constraints back one by one to narrow down which kind of minimal capacity exactly causes the problem.
Below we list all the various troubleshooting scenarios which are currently accounted for during the infeasibility analysis.
- Supplier
- There are three possible explanations in this category:
There are no suppliers available or there is no route available from the suppliers to the selected demand point.
This is an issue with the network, not enough suppliers are connected to the given customer for the given product, maybe some lanes are not active, or some suppliers are missing the given product.
There is not enough Supplier Product capacity that can be delivered to this demand point.
This is an issue of Maximum Capacity from the data table Supplier Product Data, consider raising it for the specific supplier and product elements.
There is not enough Supplier capacity that can be delivered to this demand point.
This is an issue of Maximum Capacity from the data table Supplier Data, consider raising it for the specific suppliers.
- Production
- There are two possible explanations in this category:
There is not enough production capacity which can deliver to this demand point.
Production capacities are too low, consider raising the Maximum Capacity in the data table Production Data. Another possible cause is that some Bill of material consumes too much capacity, this is controlled in the Capacity Consumed column of the data table Production Routing Data. It could also be caused by issues of connectivity in the supply chain, so, check whether some transport lanes are not active.
There are not enough productions open. The maximal number of productions may be too low.
In this case there are some productions which could potentially be used in terms of capacity and which are connected to the given customer, but still they are not used. This means that there is a problem with the maximum number of productions.
- Warehouse
- There are seven possible explanations in this category:
There is not enough warehouse product capacity to be delivered to this demand point.
Warehouse Product capacities are too low, consider raising the Maximum Capacity in the data table Warehouse Product Data. It could also be caused by issues of connectivity in the supply chain, check whether some transport lanes are not active.
There is not enough warehouse capacity to be delivered to this demand point.
Warehouse capacities are too low, consider raising the Maximum Capacity in the data table Warehouse Data. It could also be caused by issues of connectivity in the supply chain, check whether some transport lanes are not active.
There are not enough warehouses (per product) open. The maximal number of warehouses may be too low.
In this case there are some warehouses that could be used in terms of per product capacity and are connected to the given customer but are not used. This means that there is a problem with the maximum number of warehouses.
There are not enough warehouses open. The maximal number of warehouses may be too low.
In this case there are some warehouses that could be used in terms of aggregated capacity and are connected to the given customer but are not used. This means that there is a problem with the maximum number of warehouses.
The supply cannot reach the demand point, because the selected product cannot be handled by the necessary warehouses on the possible routes.
This is a problem of Maximum Capacity along possible routes from suppliers to the given customer, here both per product and aggregated capacities are considered.
There is not enough inventory product capacity to be delivered to this demand point.
Inventory Product capacities are too low, consider raising the Maximum Capacity in the data table Inventory Product Data. It could also be caused by issues of connectivity in the supply chain, check whether some transport lanes are not active.
There is not enough inventory capacity to be delivered to this demand point.
Inventory capacities are too low, consider raising the Maximum Capacity in the data table Inventory Data. It could also be caused by issues of connectivity in the supply chain, check whether some transport lanes are not active.
- Transportation
- There are three possible explanations in this category:
There are no routes to this customer location, or they all exceed the lead time. There may also be a missing lane somewhere in the network between supplier, production, or warehouse locations, which interrupts the flow of the product and prevents it from being delivered.
In this case, the customer becomes a completely isolated node in the model. Consider relaxing the lead time or allowing missing lanes, and check the availability of the lanes which go to it.
There are no routes to this customer location (using the base case lanes), or they all exceed the lead time.
This is the same issue but when for base case lanes are considered.
There is not enough transport capacity on some of the lanes.
Transportation capacities are too low, consider raising the Maximum Capacity in the data tables Transportation Data or Transportation Stepwise Costing Data.
- Leadtime
- There is only one explanation in this category:
There are not enough lanes available within the lead time.
Consider raising the lead time or relaxing this constraint.