Compare Scenarios
The Compare Scenarios page in phase 3 allows you to compare one or more scenarios with each other and with your actual stock data. This will give you insight in how your actual stock is doing compared to the scenarios that you created. It also allows you to see the impact of your changes (like desired service level) on your inventory requirements.
Scenario Stock - Bar Chart
The bar chart displays Safety Stock, Cycle Stock and Spare Parts Stock for each selected scenario (and based on your configuration). The last bar in the bar chart represents the Actual Stock according to the dataset that you’ve loaded. A more detailed explanation on this data can be found below at the explanation of the Scenario Stock - Table.
The bar chart shows the aggregated data. Individual values per resource/location/product are summed, so you see the totals.
The header of the bar chart indicates whether you see the data in units or values. This can be changed on the View panel. It also shows whether the aggregation is done over all resources/locations/products or whether a filter is applied (which can be changed on the Product Filter and Resource Filter panels).
When you want to see all details of a scenario, please go back to phase 2 - Create Scenario. There you can load the scenario and see the details at Scenario Results.
Network Stock
The Network Stock table shows the following data:
Actual Stock - The amount of Actual Stock (in the current dataset) per product summed over all the resources/locations in the Resource Filter.
Quantity in Repair Loop - For spare parts (only), this column displays for each spare part the number of items that are currently in the repair loop. This is based on your input data and the selected resources/locations in the Resource Filter.
Network Scenario Stock - For each selected scenario in the Scenarios side panel, the amount of stock in the network is displayed. For regular products, this equals the sum (over all resources/locations in the Resource Filter) of Safety Stock, Cycle Stock from Approach and, if available, Work in Progress and In-Transit. For spare parts, Network Scenario Stock equals the sum (over all resources/locations in the Resource Filter) of Spare Parts Stock. When you turn off one or more of the stock types in the View side panel, these stock types are not included in the Network Scenario Stock.
Network Scenario Stock is colored red (too little) when the Actual Stock is below the Network Scenario Stock. This allows you to easily see which scenarios are feasible from a network feasibility point of view (Does my Actual Stock cover for the amount of stock that I need in my network after re-balancing?). Network Scenario Stock is colored orange when the scenario is only (network) feasible when the Quantity in Repair Loop is added to the amount of Actual Stock.
Scenario Stock - Table
The table displays the result data, on a detailed level (per resource/location/product). The first columns display the data for each selected scenario. The last two columns display the Actual Stock according to the dataset that you’ve loaded and the Unit of Measurement (UOM) for that line in the table.
The data that is shown for each selected scenario is:
Safety Stock - The amount of additional stock that is used to mitigate risk of stockouts caused by uncertainties in supply and demand. Safety Stock for a resource/location/product is calculated based on the following input data: desired service level, demand and lead time variability (if considered), demand, (replenishment) lead time, order quantity and forecast period length.
Cycle Stock - The amount of stock that is planned to be used during a cycle of your inventory. It is the biggest of either the demand in the review period (if you consider manual periodic replenishment), or the order quantity.
Spare Parts Stock - The amount of stock that you need for spare parts to achieve the provided service level (level of confidence).
Max (= Safety Stock + Cycle Stock + Spare Parts Stock) - The Maximum Stock equals Safety Stock plus Cycle Stock plus Spare Parts Stock (depending on your configuration). At any point in the current period, this maximum can function as an upper bound of your stock levels.
AVG (= Safety Stock + 0.5 * Cycle Stock) - The average stock equals Safety Stock plus half of the Cycle Stock plus Spare Parts Stock. During the current period, on average, this will be the amount of stock, as on average, you will have your full safety stock and spare parts stock, while your cycle stock keeps going up and down.
Delta - See below.
Achievable Service level - The service level that can be achieved with the Actual Stock (in loaded dataset at time of creating the scenario). For regular products, the amount of stock that is available for safety stock (which is used to calculate the achievable service level) equals the Actual Stock minus the Cycle Stock from Approach. When creating a scenario, you can indicate which cycle stock approach you want to use. For spare parts, all Actual Stock is used to calculate the achievable service level. Achievable service level is colored red when it is below the desired service level (specified in the scenario on the Create Scenario page). Please note that the displayed achievable service level is rounded to two decimals, but for the calculations and coloring, unrounded numbers are used.
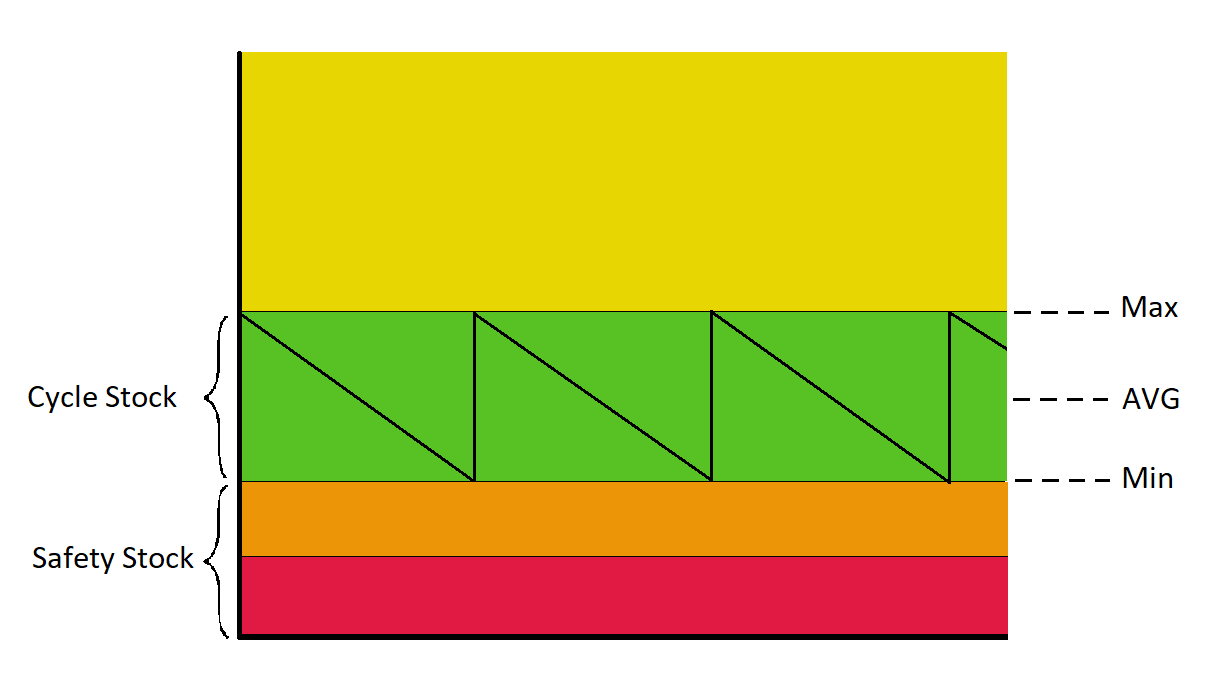
Delta (= Actual Stock - Max) - This represents the difference between Actual Stock (in loaded dataset) and Maximum Stock (calculated in the scenario). It is colored based on the following (numbers are just examples):
Too Much (Yellow) - There is too much Actual Stock. This is undesirable as it results in unnecessary stock costs.
Within Target (Green) - Actual Stock is within target. This means that the inventory level is within the desired lower bound (Safety Stock level) and upper bound (Cycle Stock level), or it is exactly equal to the Spare Parts Stock level.
Service Risk (Orange) - Actual Stock is below the Safety Stock level but above half of the Safety Stock level. This means that there is a service risk.
Too Little (Red) - There is too little Actual Stock. It is below half of the Safety Stock level or below the Spare Parts Stock level. This is very undesirable as the service risk is big.
In the picture below, you can see how the different stock types and colors relate to each other for regular products. Delta is colored based on the area in which the Actual Stock is.
The header of the table indicates whether you see the data in units or values. This can be changed on the View panel. It also shows whether all resources/locations/products are displayed or whether a filter is applied (which can be changed on the Product Filter and Resource Filter panels).
Export Scenario(‘s)
After inspecting your created scenarios, you can export one (or more) scenarios to the database such that you can use them in another app (S&OP). You can do this by clicking on Export Scenario(s) in the page actions menu.
The Export Results dialog will pop up and you can select here which scenario(s) you want to export to the database. After that, click on Finalize. The selected scenarios will now be exported and become dataset(s) in the database. Read here about the switches on this dialog.
It is possible to delete scenarios in phase 2 of the app. You can read here how you can do that. Please note that scenarios that are saved to the database, become datasets. When deleting a scenario, datasets are not deleted from the database. You can delete a dataset from the database in Data Navigator.
Periods in Inventory Planning
Inventory Planning calculates stock data for a single period. It is possible to calculate Safety Stock for multiple periods. In your configuration you must indicate that you want this, after which you can provide demand data for multiple periods. The app will calculate a coverage value based on the single period Safety Stock calculation, and with that coverage value, it calculates the Safety Stock for multiple periods. In this calculation, it is assumed that there are no changes over the horizon regarding the network. Only multi period demand data is used. When your dataset does contain other data for multiple periods, this data is ignored. In the Inventory Planning app, you will only see data for the current period. Safety Stock is also only visible for the current period, but when exporting the output data to the database, the multi period Safety Stock is exported as well.
View
In the View panel on the right, you can select in what unit of measurement you want the data to be displayed. You can see the data either in value (currency specified in your configuration) or in units. In case you have multiple units of measurement provided in your dataset, you can see the data in either the base unit (specified in your configuration) or the product UOM when that data is displayed on a product level.
In the View panel you can also select which types of stock are displayed. Turning off some of them, might be convenient when you want to compare two columns. An explanation of these stock types can be found at Scenario Stock - Table above.
Scenarios
In the Scenarios panel on the right, you can select which scenarios you want to compare on this page. Read here about the switches on this side panel.
Product Filter
Read here about the working of the Product Filter.
Resource Filter
Read here about the working of the Resource Filter.
Help
Read here about the Help panel.