KPI Overview
On this page you can explore the costs and the revenues from different perspectives supported by the following sections:
Custom Objectives
Overview
There are two components of an objective, namely Cost and Revenue.
Revenue includes:
Total Physical Revenue, which is Customer related.
Custom Objectives, which are in ‘Revenue’ Type. Each Custom Objective may have revenue data in the following categories: Customer, Supply (Fixed, Variable, Open/Close), Production (Fixed, Variable, Open/Close), Warehouse (Fixed, Variable, Open/Close), and Transport.
Cost includes:
Total Physical Cost, which comprises the categories mentioned previously.
Custom Objectives, which are in ‘Cost’ Type. Each Custom Objective may have cost data in Customer, Supply, Production, Warehouse, and Transport categories.
The three widgets on the top of this page show the breakdown of the costs and the revenue as described above.
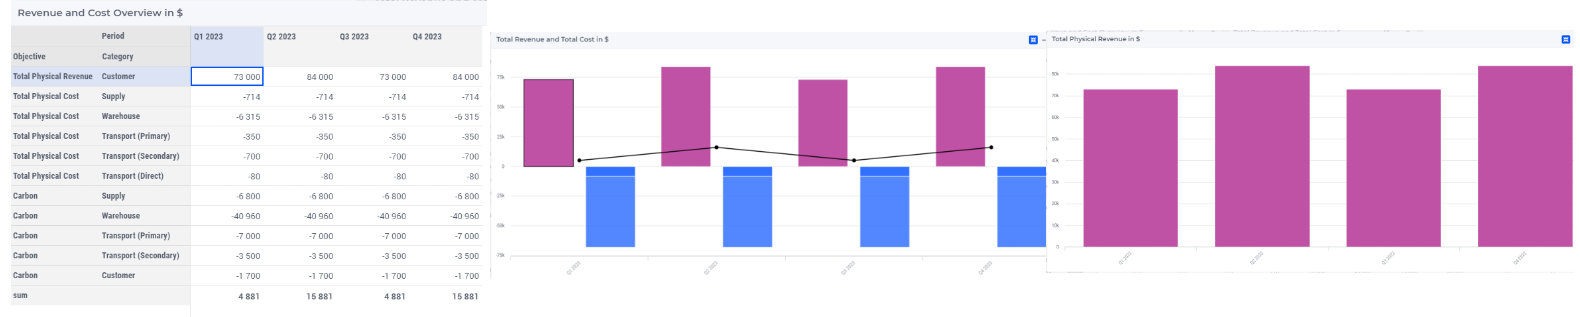
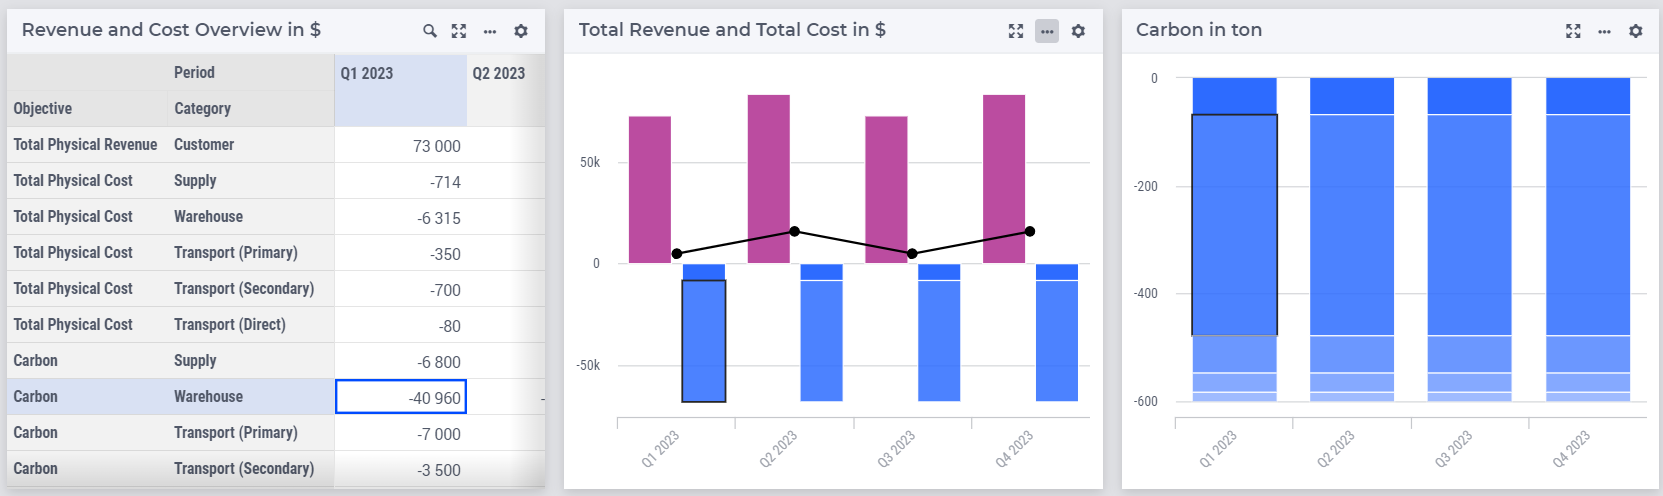
The first table displays precise figures of revenue and cost, while the middle bar chart presents a visual representation of those figures in Total Physical Revenue, Total Physical Cost, and Custom Objectives. On the middle bar chart the total profit is shown with a black line together with the revenue (purple) and cost (blue). The bar chart on the right hand side shows a more detailed breakdown of the figures in the previous chart by categorizing them into five different groups: Customer, Supply, Production, Warehouse, and Transport. The content of the bar chart depends on which category (Total Physical Cost, Total Revenue, Custom Objective) is selected in the first table. The selected element will get a black border. For example if you click on the warehouse carbon cost for the first period (-40960), on the middle bar chart this element of the total cost will get a black border and the third bar chart will show the Carbon cost, and in the first period the warehouse component will get a black border. (see the picture below)
It is worth mentioning that if the dataset contains only cost data and lacks revenue data, then the cost values will be presented as positive. Additionally, all three widgets display values in currency units. The two bar charts show revenue by using purple color and cost by using blue color.
For example, in the picture above the Revenue which comes from the Customer is 11 billion and the cost in Warehouse is 824 million.
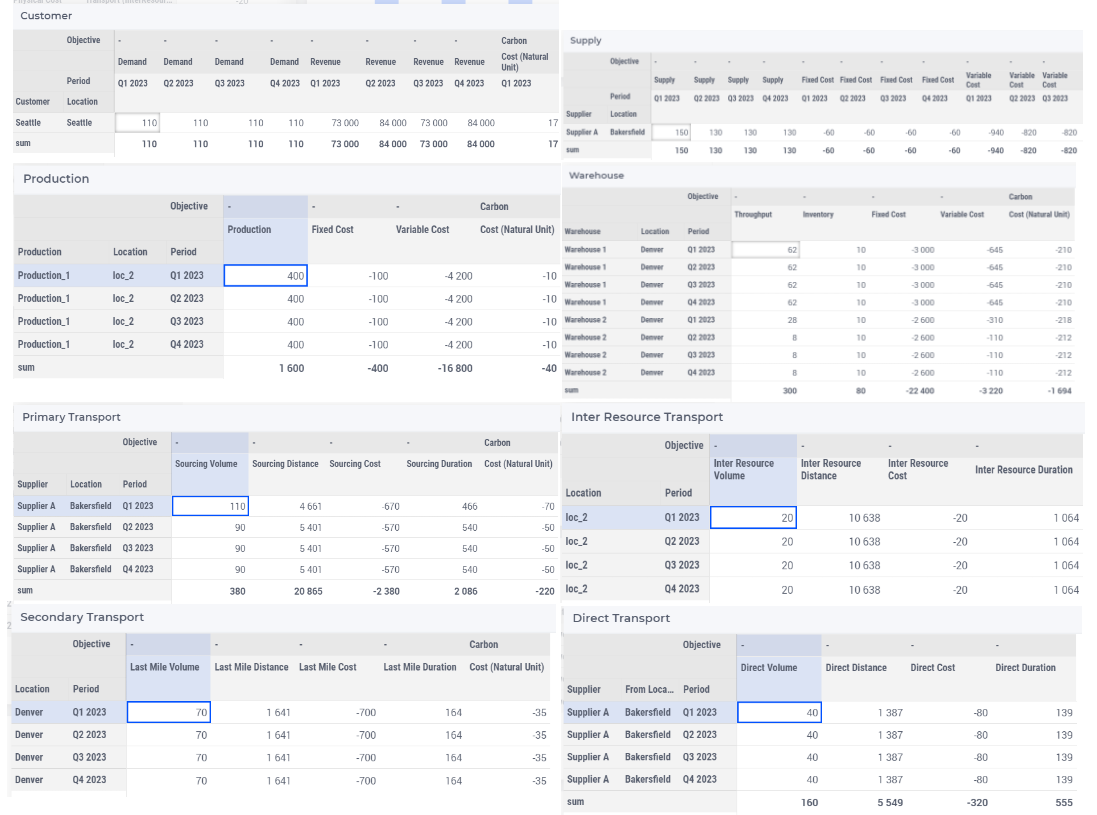
Tables On The Page
These tables show more detailed information about the revenue/cost, and demand/volume for Customer, Supplier, Production, Warehouse and Transport, but the data is not as detailed as the content of the tables on the other result pages. For example these tables don’t show information about capacity. These tables show only cost related data like:
Fixed Cost
Variable Cost
Closing/Opening Cost
Note
In Warehouse table, when there is “Inventory Available” in the dataset, the “Throughput” column will be come separate columns as inbound and outbound.