Whiteboard
Overview
Embarking on a supply chain modeling journey with a blank Excel template can be overwhelming. Usually, one needs to start by building several data templates which reflect the structure of the supply chain network and the interactions between its various components.
The unique feature of the SC Navigator called Whiteboard offers an intuitive solution for making this process seamless. On an interactive canvas, the users can visually map out their supply chain network by adding and connecting supplier, production, warehouse, and customer nodes. As this visual representation is being built out, the users can define node parameters such as capacity, costs, demand, and other key data. Once the supply chain diagram is completed, the Whiteboard functionality can generate a fully populated Excel template reflecting the visual network design.
This seamless translation from the visual representation to structured data allows the users to grasp the process of converting their real-world supply chain problems into meaningful network optimization scenarios. By leveraging the Whiteboard feature, SC Navigator empowers users to develop models rapidly and to uncover data-driven insights, which drive informed decision making and maximize their supply chain performance.
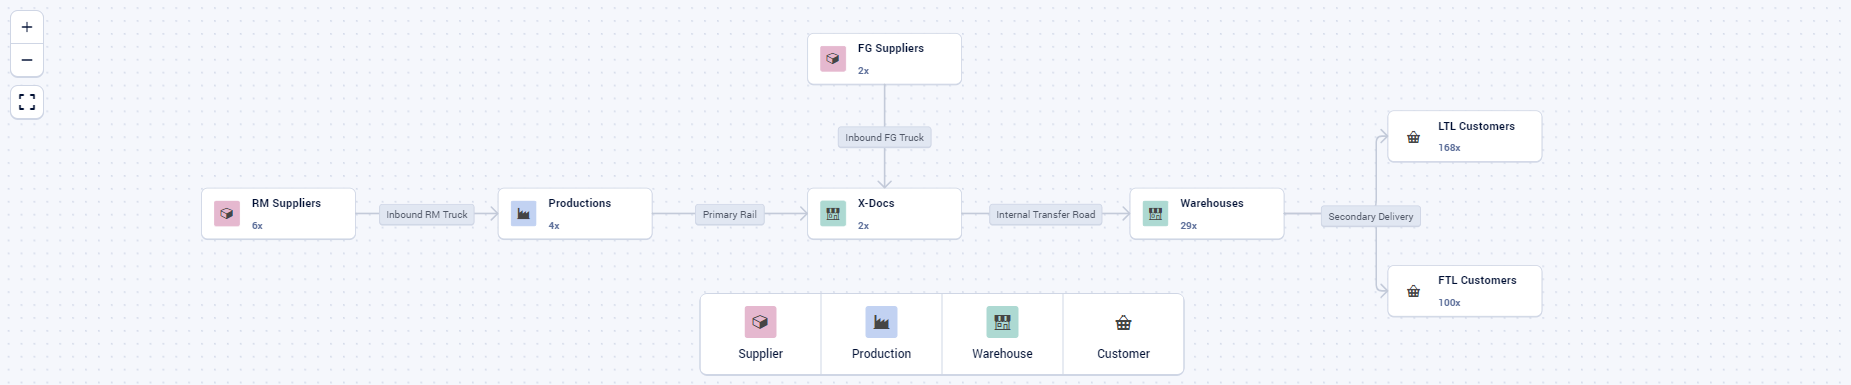
An example of a supply chain network diagram.
Features
The users can organize their supply chain network diagram by adding nodes for:
Suppliers
Productions
Warehouses
Customers
Nodes in the Whiteboard can be connected using arcs, which represent transport lanes. Different modes of transport can be specified for these transport lanes. The users have the ability to define products within two main categories: Raw Materials and Finished Goods. Each node can be customized to support a specific selection of products. The Settings dialog provides the users with the ability to add and edit modes of transport, products, units of measurement (UOMs), and the time period name.
A node in the Whiteboard can represent either a single facility or a group of facilities. For example, if users want to represent all their suppliers in Europe with a single Supplier node, then they can add a Supplier node to the Whiteboard and subsequently, they can open the Edit Supplier Info dialog and choose the desired number of suppliers. The name and location for each supplier can be captured accordingly.
Data Input
The users can add operational data for each node and each transport lane in the network. The following data fields are available for all the nodes and the corresponding facilities (note that data may be attributed to specific products at a facility):
Minimum Capacity
Maximum Capacity
Fixed Cost
Variable Cost
The product demand can be provided for each customer. At production nodes, it is also possible to provide Bill of Material (BOM) data when Raw Material products are present. A BOM is automatically created for each product in the Finished Goods group. You can read more about BOMs in the section Bill of Material Groups.
The following data may be added for the transport lanes on the Whiteboard:
Minimum Capacity
Maximum Capacity
Cost per Distance
Cost per UOM
The specification of the input data for a transport lane is done on the group level, meaning that, for a given mode of transport, the input data will be used for all the products which are transferred between the source node and the destination node.
Template Generation
The key advantage of the Whiteboard feature is its ability to instantly convert a visualized supply chain network into an optimization-ready data template. The generated template contains pre-formatted sheets with all the nodes, connections, and parameter data from the Whiteboard. This optimization-ready template can then be fed directly into the main optimization model used by the SC Navigator.
User Workflow
Step 1: Open the Whiteboard
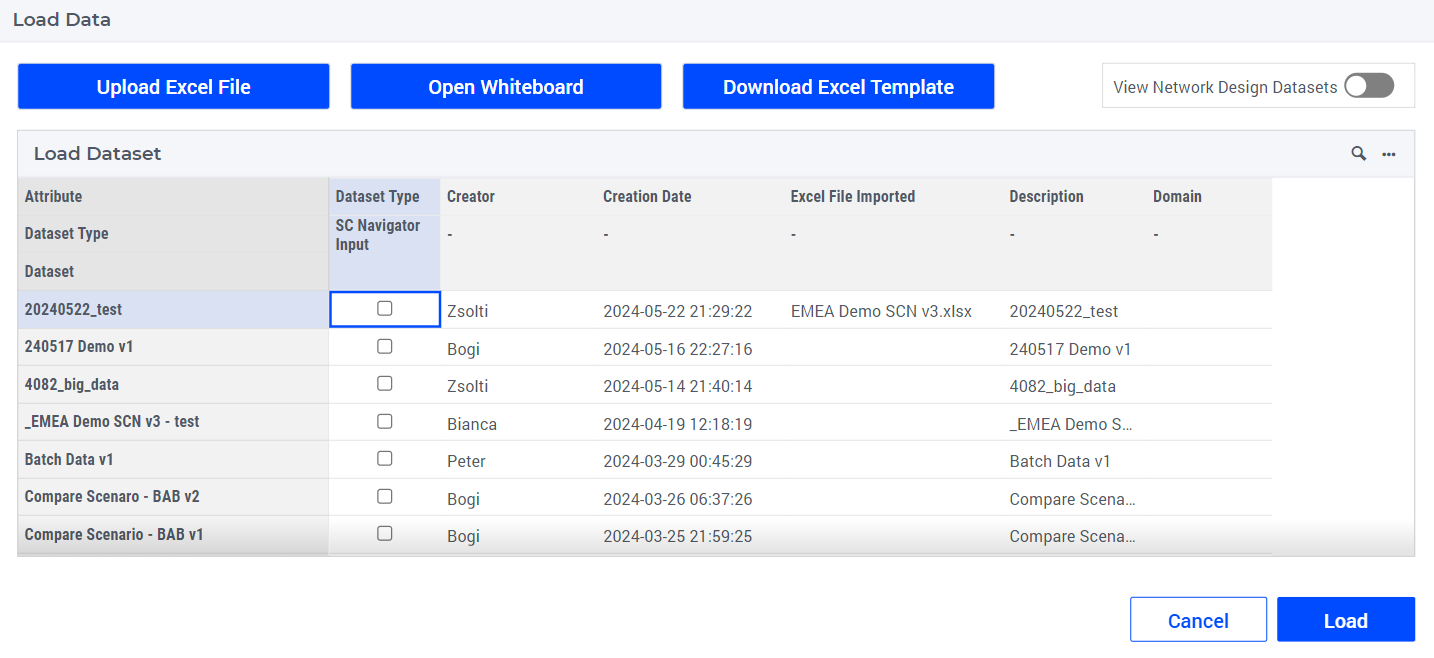
In order to visit the Whiteboard page, open the Load Data dialog from the Status Bar and click on the button Open Whiteboard. The Load Data dialog also shows up automatically when the SC Navigator application starts up.
Step 2: Configure the Settings
The workflow for using the Whiteboard feature can be likened to drawing your supply chain on a physical whiteboard.
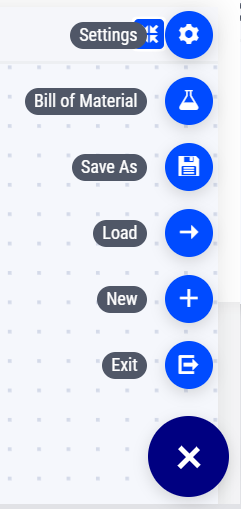
Bottom-right page action options
Firstly, it is important to define some key components of your supply chain, such as the number of finished goods flowing through the network, the different modes of transport, the units of measurement, and the time period. These components can be configured in the Settings dialog, which can be accessed through a page action.
Additionally, you have the option to provide a description for each mode of transport, raw material, and finished good. Once all the necessary supporting data have been entered, click the Ok button to close the Settings dialog.
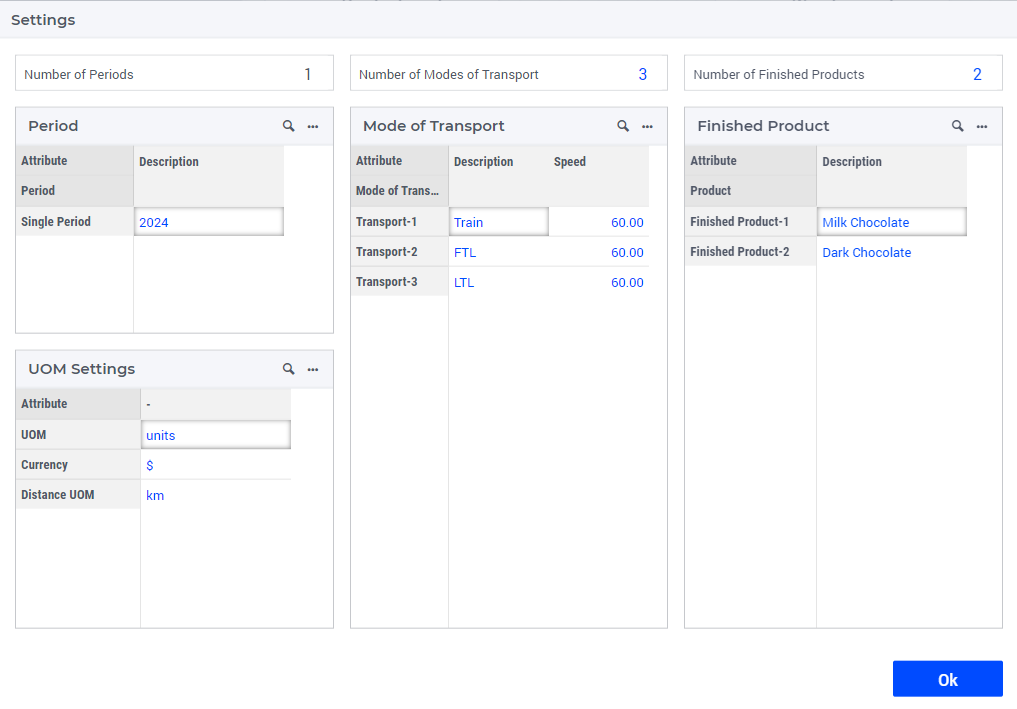
Settings dialog for underlying data
Data for Bill of Material is configured in a separate dialog. It is also accessed through a page action. In that dialog you can provide the number of raw materials, and detailed data for each Bill of Material.
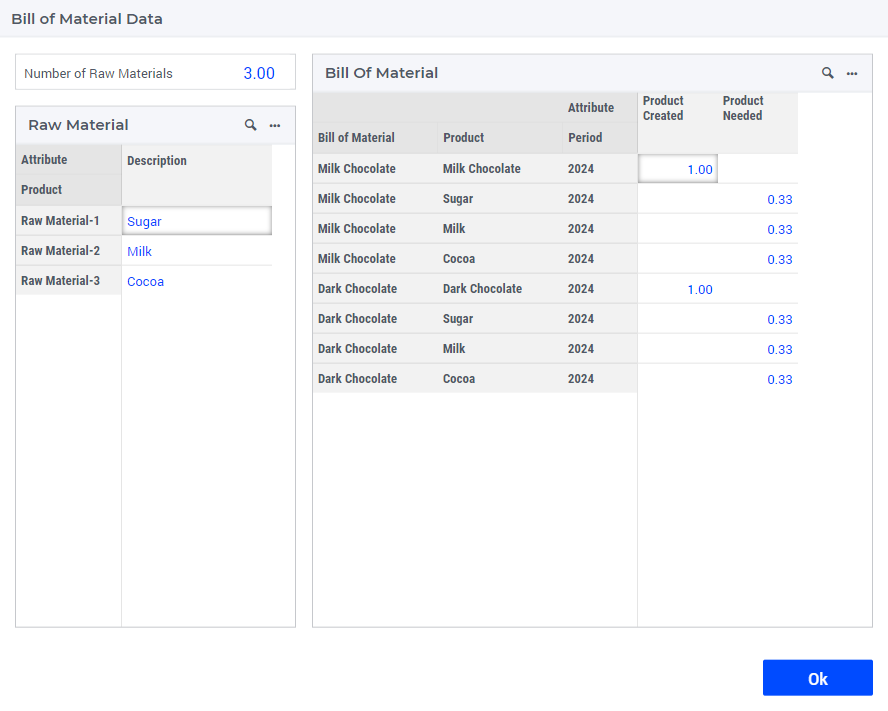
Bill of Material dialog
Step 3: Draw Your Supply Chain Network
Drag and drop Supplier, Production, Warehouse, and Customer nodes to create a visual representation of your supply chain network. Remember, nodes can be treated as groups, which can streamline the modeling process. By right-clicking on a node and selecting Edit Node Info, you can decide how many facilities are present, where the facilities are located, and which products are supported.
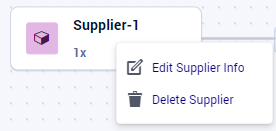
Right-click on a supplier node
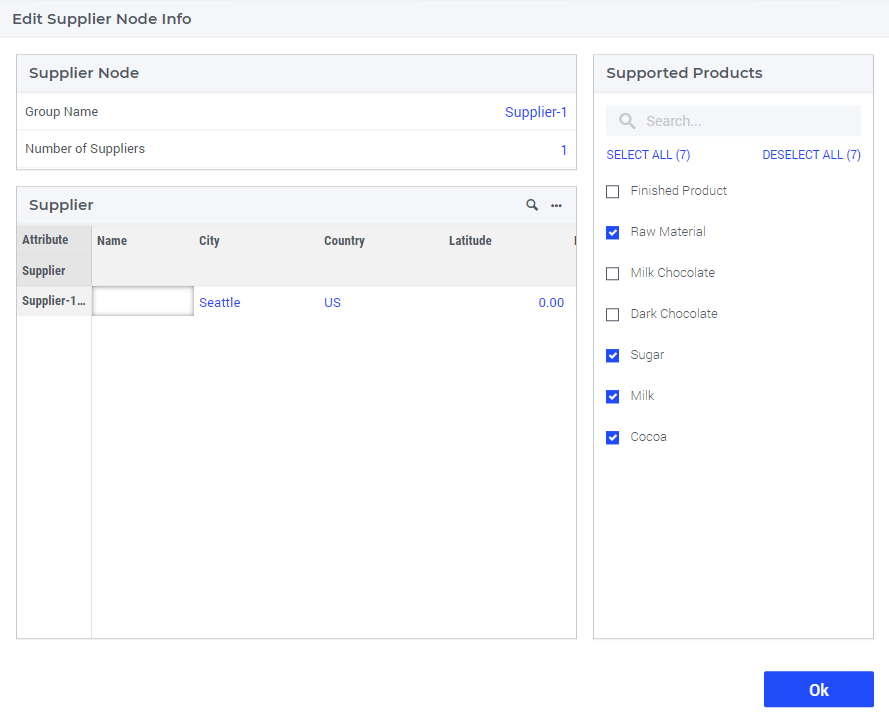
Edit node dialog
To establish a transport lane between two nodes, simply click near the edge of the source node and drag the mouse until it reaches the destination node. You will notice that the destination node is highlighted with a yellow border, indicating that the Whiteboard has successfully recognized the transport lane connection.
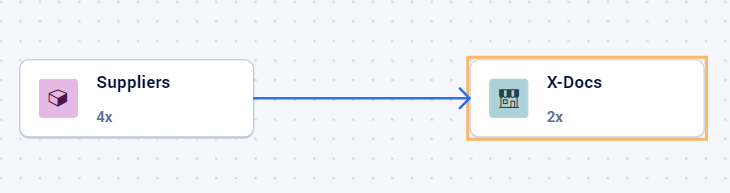
Create an arc between two nodes
By right-clicking on an arc and selecting Edit Arc Info, a description can be provided for the transport lane and the supported modes of transport can be selected.
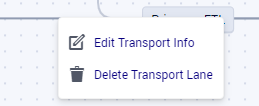
Right-click on an arc
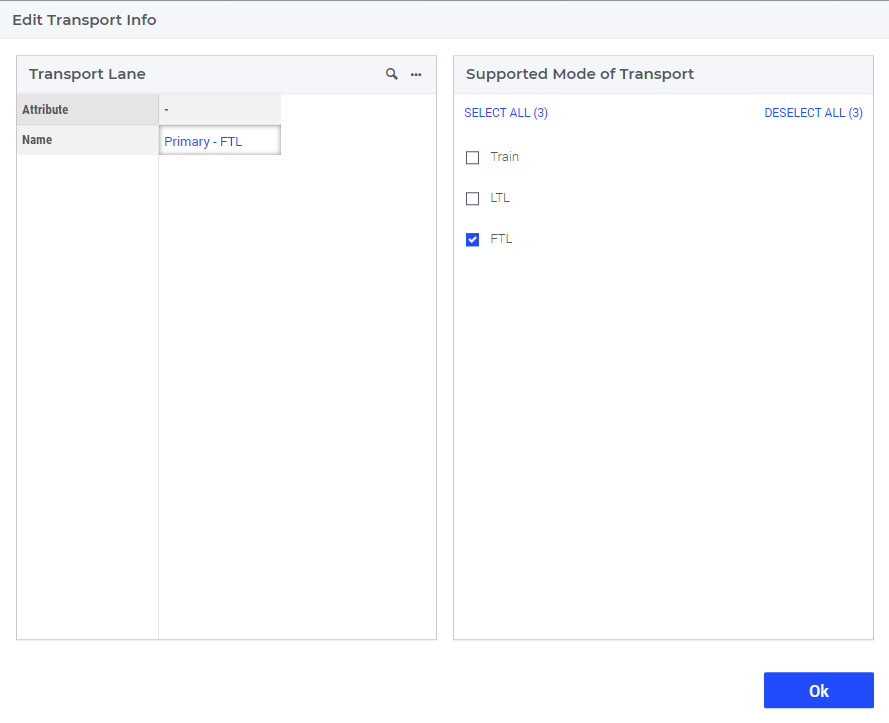
Edit arc dialog
The bottom half of the Whiteboard page shows several data tables in which one may capture some additional data for nodes and arcs. To edit this data, click on a node/arc and the data pertaining to that node/arc will be displayed in the tables. In some cases it may be more efficient to view all data for a given node set (e.g., data for all suppliers, not just a particular one). Viewing all the data for a node set can be achieved by using the widget action Show All.
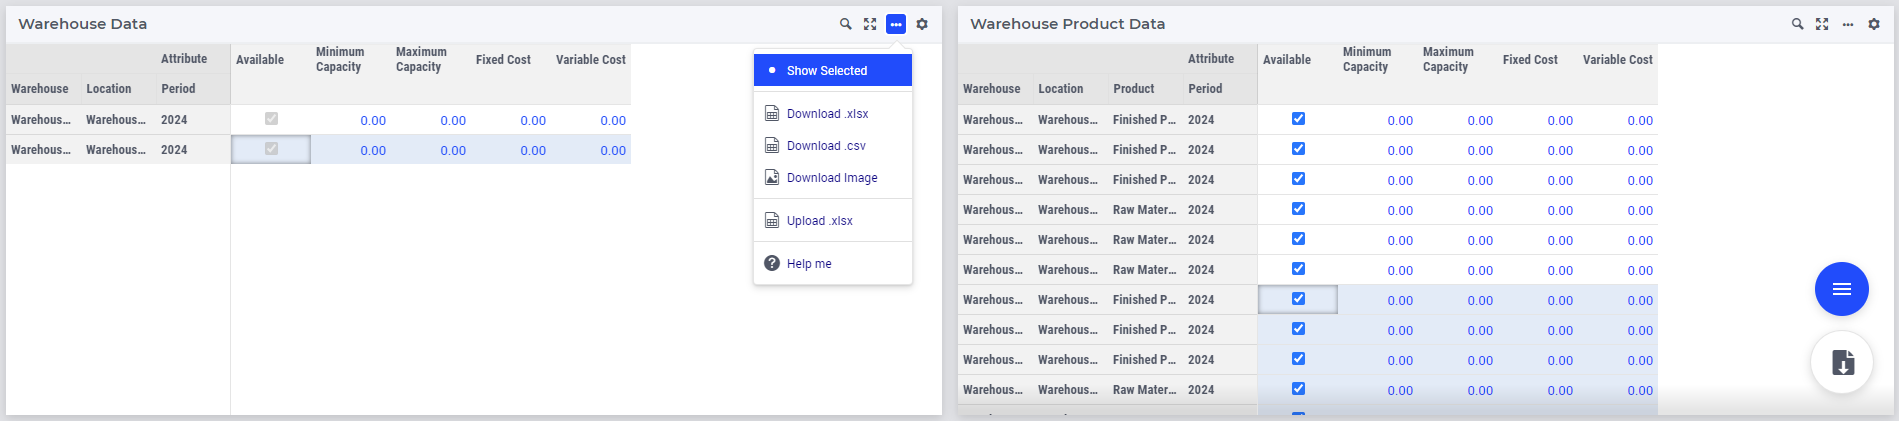
Data for warehouse nodes
Step 4: Save As, Load, and Download
To save a Whiteboard diagram, click on the page action Save As and follow the instructions provided in the subsequent dialog. Similarly, to load a previously saved Whiteboard diagram, click on the page action Load. The Save As and Load options enable the development of a Whiteboard diagram over multiple sessions and allow for sharing the diagram state among multiple users.
Once you have drawn your supply chain network and entered all the necessary data, the template is ready to be downloaded. It is important to note that the template can be downloaded at any step in the Whiteboard workflow, however, during the early steps there may not be sufficient data yet in order to optimize the network.
To download the template, click on the page action Download  .
In the download dialog you have the option either to exit the Whiteboard and return to the main SC Navigator page (where the template can be uploaded), or to return to the Whiteboard.
.
In the download dialog you have the option either to exit the Whiteboard and return to the main SC Navigator page (where the template can be uploaded), or to return to the Whiteboard.
Step 5: Edit, Upload, and Optimize
It is recommended to open the downloaded template in Excel and examine how the supply chain network diagram has been translated into the different sheets, rows, and columns. The Excel template also offers more data attributes that may be useful to include in the model. For more details on these attributes, please refer to the documentation on the template. Since the overarching structure of the supply chain network has already been captured, including additional attribute data in the template is rather straightforward.
The template can be uploaded to the SC Navigator application directly after downloading it or it can be edited before uploading. To upload the template, follow these steps:
Open the main SC Navigator page.
Navigate to the Load Data Dialog from the status bar.
Click on button Upload Excel File and select the Excel file you want to load. After selection it will be uploaded right away.
After uploading, the template undergoes a data validation process to identify any potential issues. For more information on this, please refer to the documentation on data issues.
Once the data has been validated, the optimization engine can utilize the template as input in order to generate optimized supply chain network designs.
Benefits of Using the Whiteboard
The utilization of the Whiteboard tool offers a user-friendly starting point for supply chain network optimization, which is especially beneficial for new SC Navigator users. This tool allows the users to visually outline their network structure before establishing its optimization parameters.
The ease of use of the Whiteboard enables swift and convenient adjustments, leading to faster design iterations and a reduction in potential errors caused by manual modifications of the Excel templates. By leveraging the Whiteboard, the users can expedite the development of their supply chain network structure, allowing for more time to focus on formulating business questions, scenarios, and fine-tuning the template.
Therefore, the Whiteboard significantly simplifies the process of getting started with the SC Navigator optimization software.