Status Bar
In this section we discuss the status bar which can be found at the bottom side of a page in the application.
On the status bar you can find different buttons related to loading the input data and to some information about the results, namely:

UOM (Units of Measurement)
This part of the status bar provides some information about the used units of measurement (UOM). When hovering over this button, the tooltip helps by showing more information.
KPI Summary
This shows the objective value after optimization. When clicking on this button a dialog page will appear:
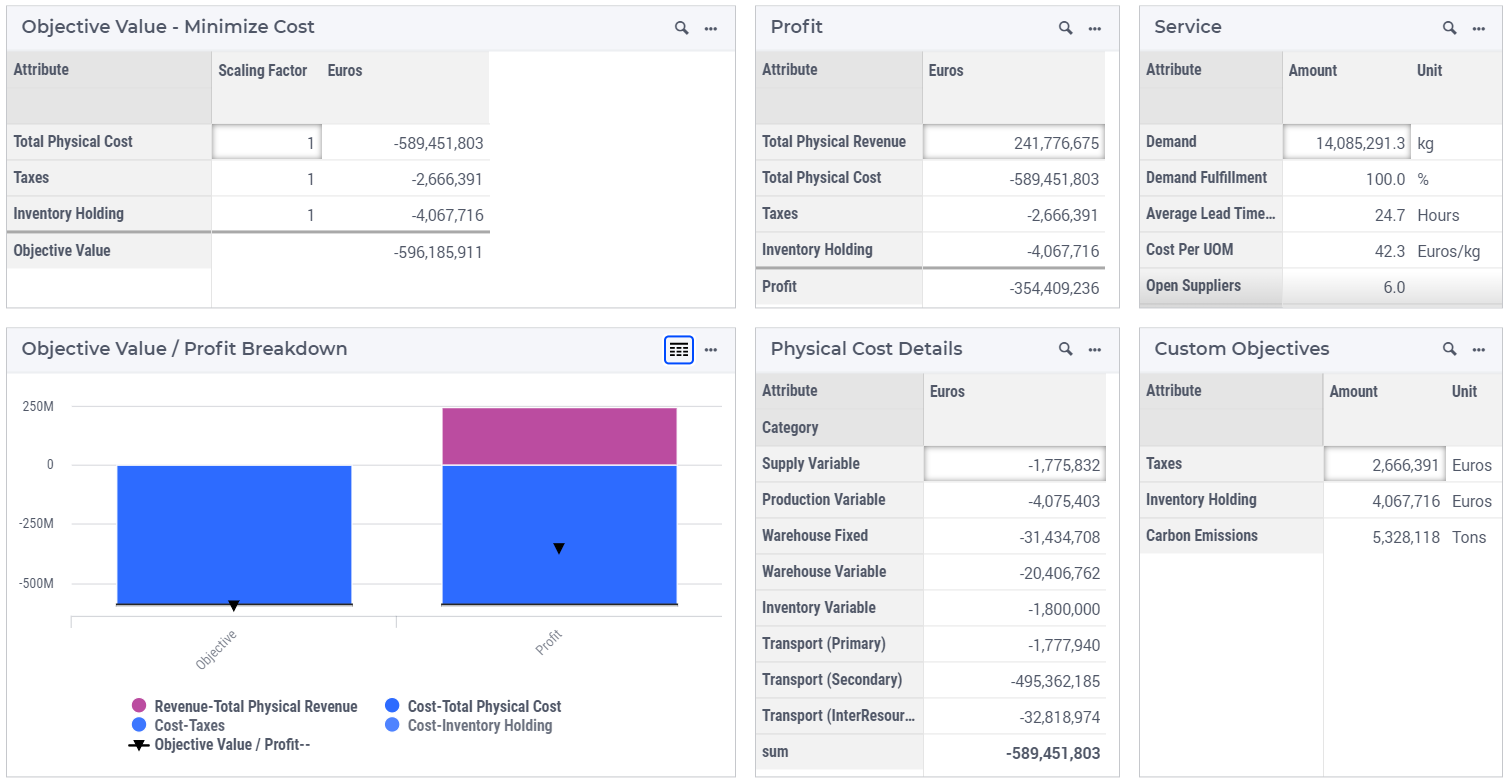
On this dialog page you can find details about the objectives.
Table Objective Value shows the physical cost/revenue and custom objectives’ cost/revenue. The quantities (and their unit) in natural unit and currency are also included in this table. If the objective’s UOM is the default currency UOM, then its amount is not shown. Only the objectives that are selected in the Included in Objective in the table Optimization Options are shown in this table.
Table Cost and Revenue shows all physical revenue/cost and custom cost/revenue objectives in currency, and the resulting profit in currency. Objectives with UOM that are different from the default currency UOM are not shown in this table.
Table Service shows several KPIs: the amount of total Demand, percentage of Demand Fulfillment, Weighted Average Lead Time, Cost Per UOM, and the number of Suppliers/Productions/Warehouses that are open at least once across all periods. Weighted Average Lead Time is calculated by multiplying the lead time by the corresponding demand, and then dividing the sum of these values by the total demand. Cost Per UOM is calculated by dividing the objective cost value by the fulfilled demand.
Table Physical Cost Details summarize types of costs in currency and their total.
Table Custom Objectives shows the custom objectives’ cost/revenue amount in their corresponding unit.
The Objective Breakdown chart shows the objective value breakdown in two bars. On the left, it focus on the objective value, which is calculated from the objectives that are selected in Optimization Options table. If a UOM is not in currency, then its amount will multiply the scaling factor and becomes the value in currency. On the right, it focus on calculating the profit from all currency UOM objectives, regardless whether an objective is selected in Optimization Options table.
Number of Completed Runs
This part of the status bar shows how many optimization jobs are completed, including both single jobs and batch runs.

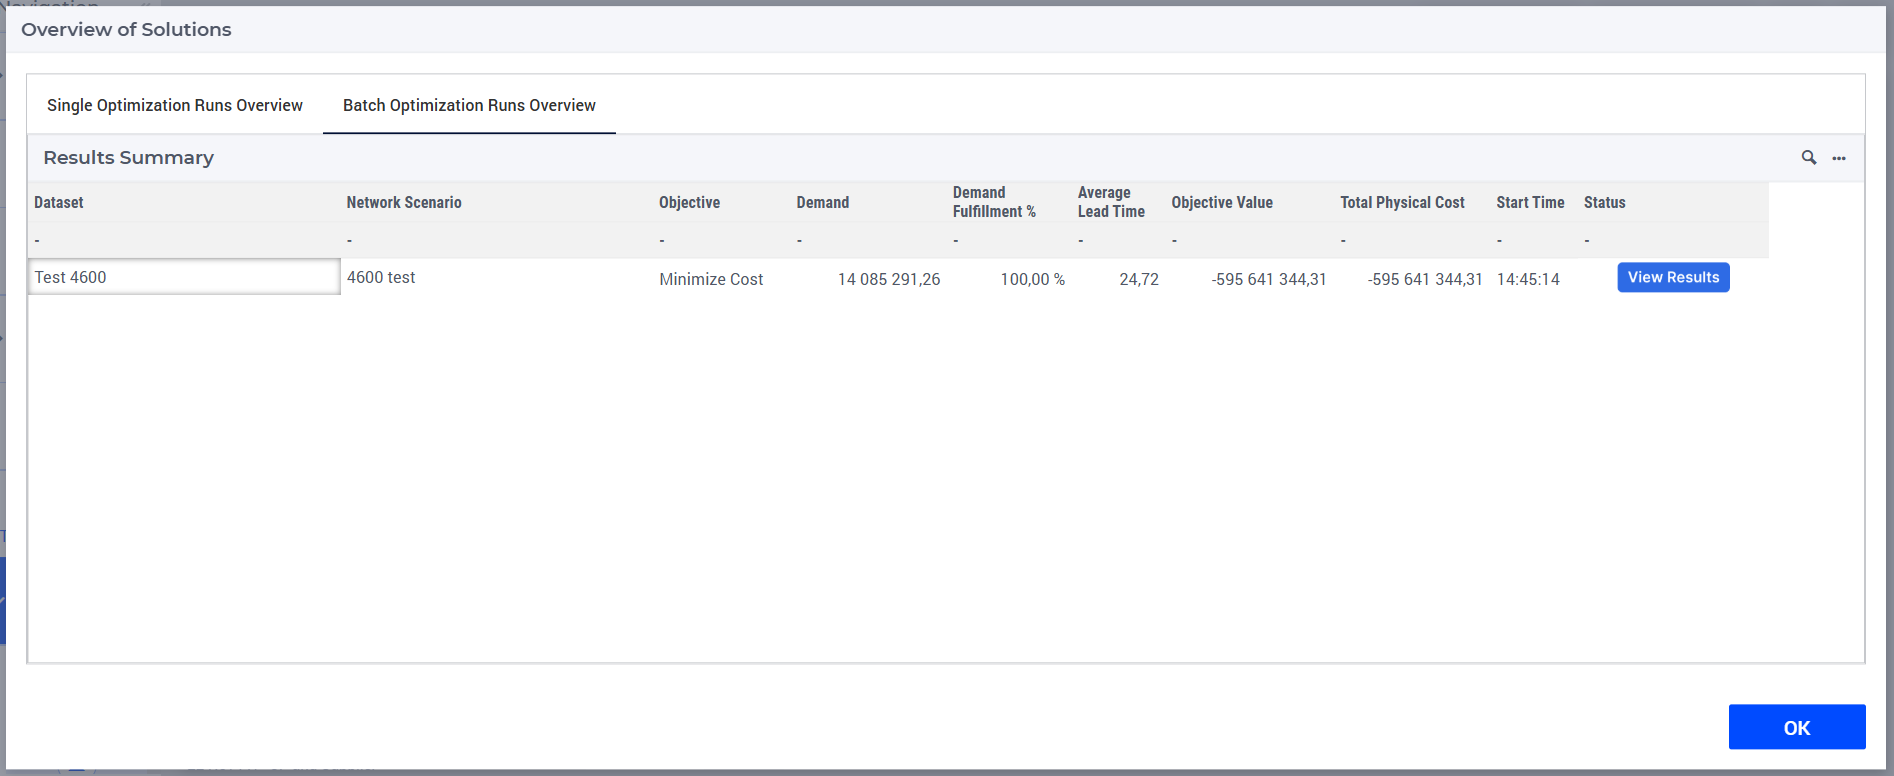
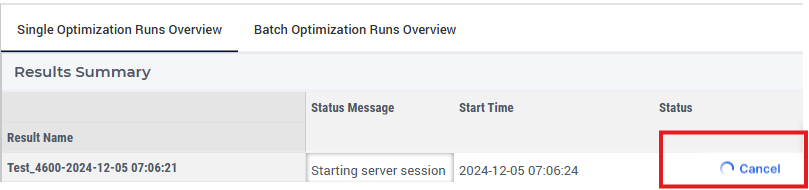
By clicking on the status bar item, a dialog page will open, where you can view and load the results of previous runs. The dialog page includes two tabs and you can easily switch between the Single Optimization Runs Overview and the Batch Optimization Runs Overview.
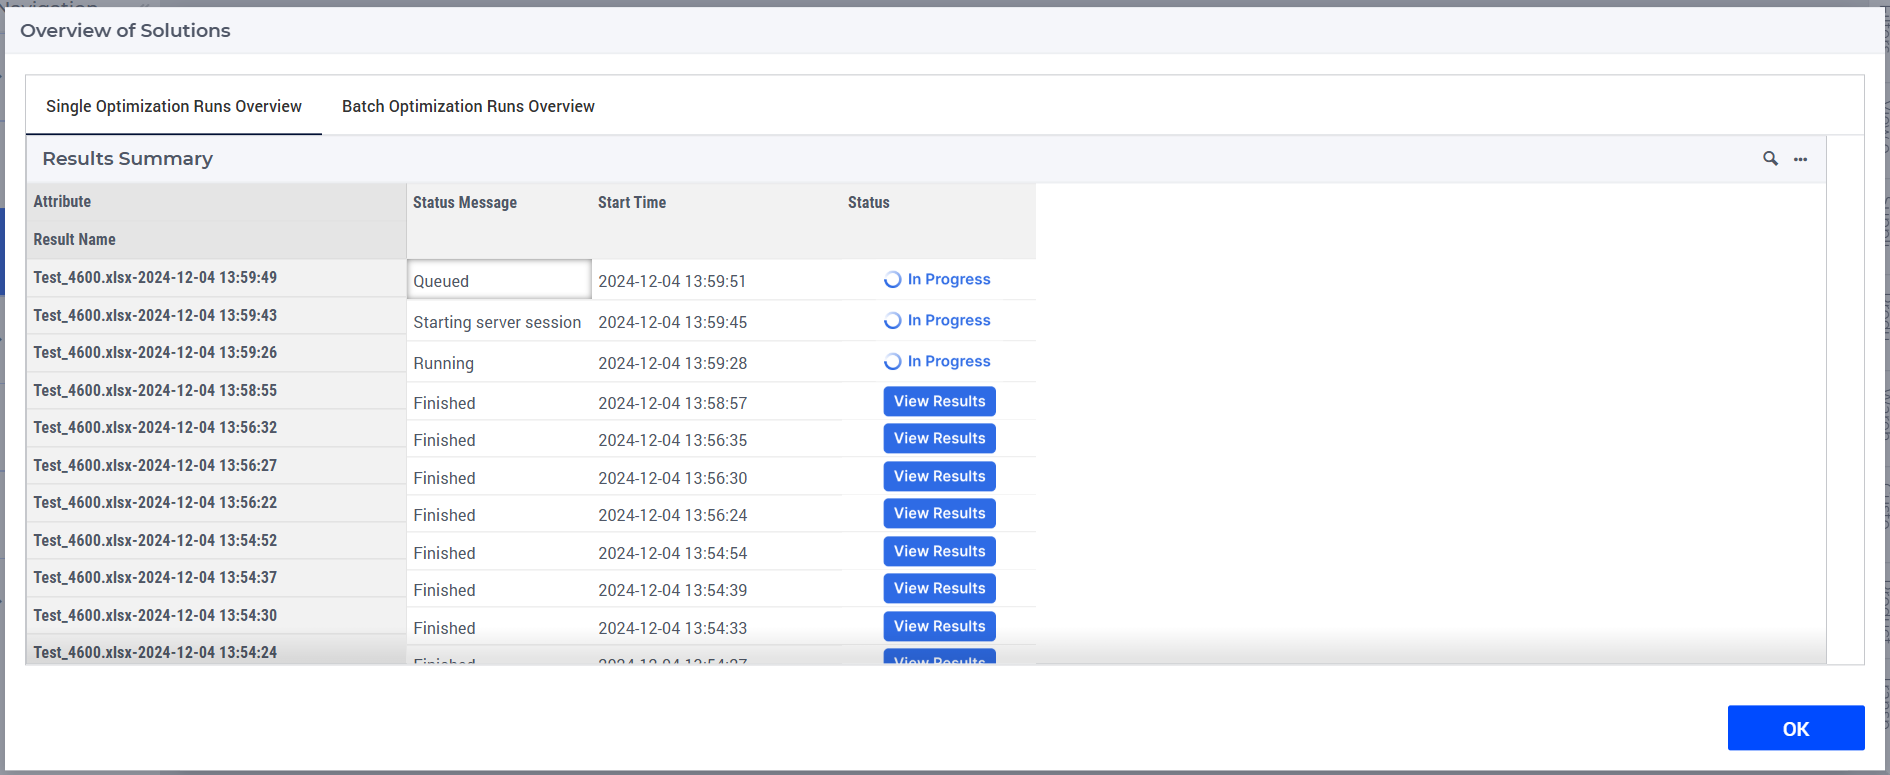
On both tabs for jobs in progress, an “In Progress” label will appear, and for completed jobs, you can click the  button to load and view the results. You can stop both single and batch runs from running: hover over the In Progress field to reveal the Cancel option.
Additionally, there are some differences between the two tabs:
On the Batch Optimization Runs tab, once a run is completed, some main KPIs will be displayed in the table for a quick overview. When a run resulted in an error or infeasibility, this is also displayed. This is not the case for Single Optimization Runs.
For Single Optimization Runs, the results will be retained for 30 days. After closing your session and starting it again within 30 days, you can still see the runs and load the results. For Batch Optimization Runs only the runs started in the current session, are visible. So, when you open SC Navigator (after your previous session has been closed), the Batch Optimization Runs tab will be empty. Therefore, you should keep your session open while running a Batch Optimization. You can read more about Batch Optimization Runs in the section Scenario Navigator.
Results Data
When clicking on this button from the status bar a dialog page is opened:
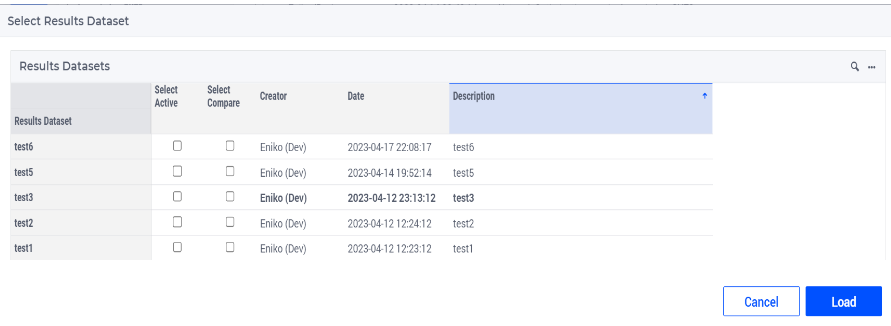
Here you can Select Active scenario, Select Reference scenario and Select Reference Map.
Select Active: the selected dataset will be the input data and if it has already been optimized, you can also review the results.
Select Reference: the selected dataset will be the reference, so you can compare the active dataset to the selected reference
Select Reference Map: this option is only available when the you are on the Results main page. In this case the selected data will become visible on the reference map.
Network Scenario
When clicking on this button from the status bar a dialog page is opened:
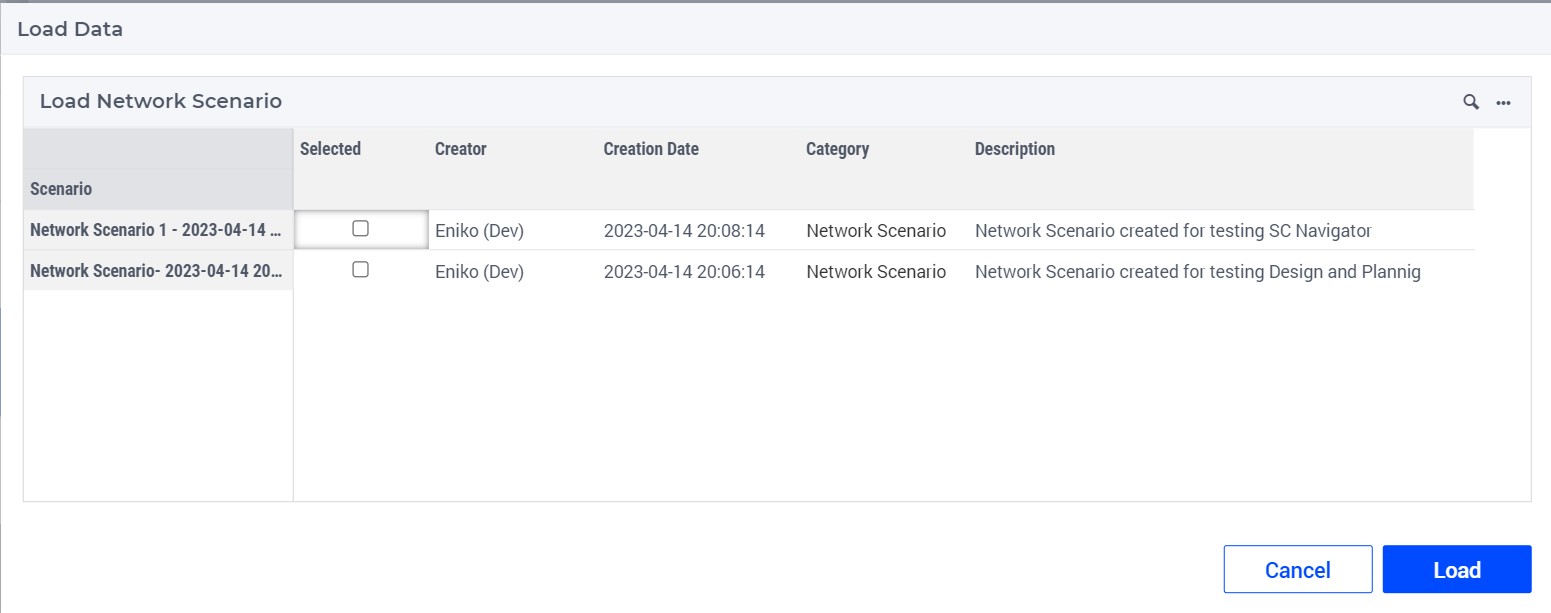
Here you can load a Network Scenario in order to review the saved data. You can read more about scenarios in the section Scenario Navigator.
Input Data
When clicking on this button from the status bar a dialog page is opened:
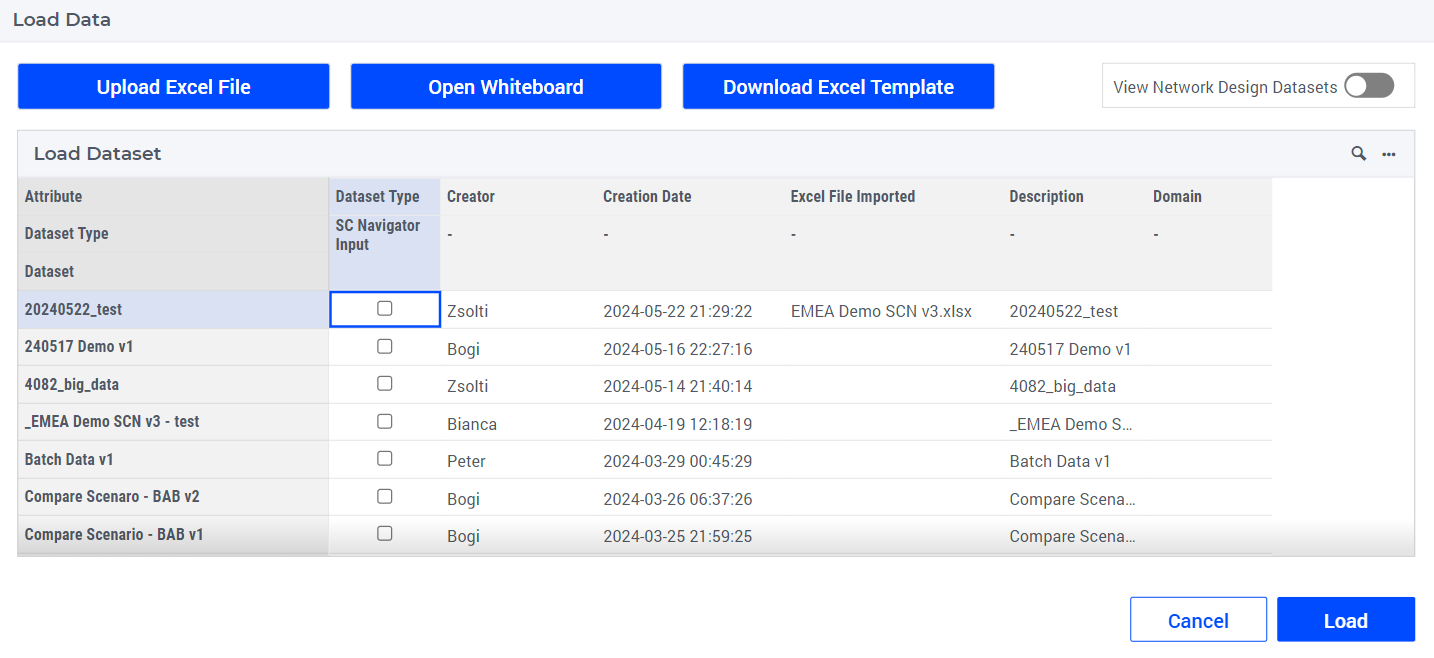
Here you can upload an Excel file, navigate to the Whiteboard, download a blank template, or select an input dataset from the previously saved ones.
You can read more about loading data in the section Load Data Dialog
Business Unit
If this user belongs to multiple data separated groups, see Data Separation, an extra item appears on the status bar:

When clicking on this item, a dialog appears with the available groups for this user and you can switch to a different group.
Help
On every page in the application there is a help icon at the end of the status bar, which looks like this  .
.