End To End Results
This page shows more details about the costs shown on the Cost To Serve Report page. It gives a visualization of how different products flow from Suppliers/Productions through Warehouses to Customers.
You can select a level (Supplier/Production/Warehouse/Customer) and then Locations or Facilities/Customers to show how products flow in the supply chain.
If you select a Customer you will see all the Facilities which are in the supply chain of that Customer.
If you select a Facility you will see all the Customers which have that Facility in their supply chain, as well as all the other Facilities which are connected to the originally selected Facility in order to supply the before mentioned Customers.
For more details please see the Select Level section below.
You can read about the period selector in Period Selector.
Filters on End-to-End Page
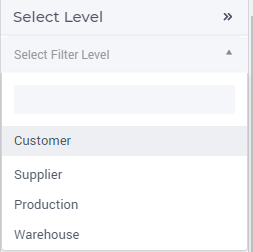
Select Level
Before visualizing supply chains on the map, you have to choose the filter level to work with. You can select from Customers, Suppliers, Productions, and Warehouses levels.
Locations or Production Facilities/Warehouses/Customers on another level will be visualized on the map and in the table only if they are part of the supply chain of the selected ones.
If you select a Level, the Filters of that level will be active on the side panel, under the Select Level
Supplier/Production/Warehouse/Customer Filter
The type of this filter side panel depends on the selected level which can be Supplier/Production/Warehouse/Customer. For example, if the selected level is the Customer level, this filter contains all the customers defined in the input data.
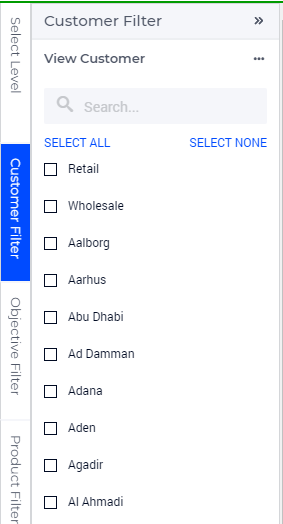
Use the checkboxes to filter by Customer. In that case, only the data of the selected customer will be displayed on the page.
You can switch to the location view as follows:
Click on the icon
at the upper right part of the filter side panel
Click on the Switch to location view option
Objective Filter
This side panel contains the objectives related to costs and revenue, such as:
Total Physical Revenue
Total Physical Cost
Custom Objectives
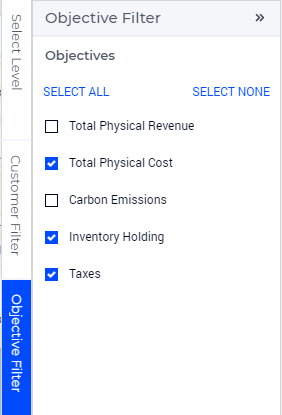
Use the checkboxes to filter by Objectives. In that case, only the data of the selected objectives will be displayed on the page.
Product Filter
This side panel contains all the products defined in the input data.
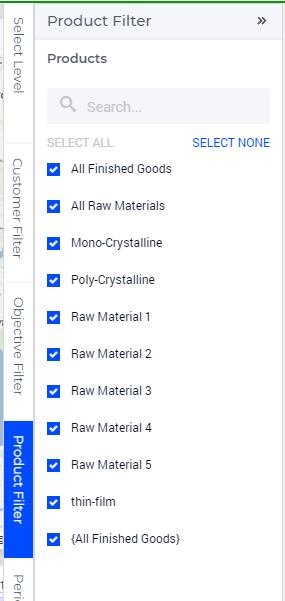
Use the checkboxes to filter by Product. In that case, only the data of the selected product will be displayed on the page.
Period Filter
This side panel contains all the periods defined in the input data.
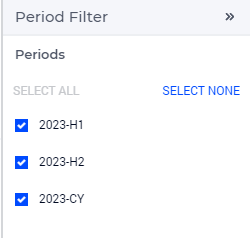
Use the checkboxes to filter by Period. In that case, only the data of the selected period will be displayed on the page.
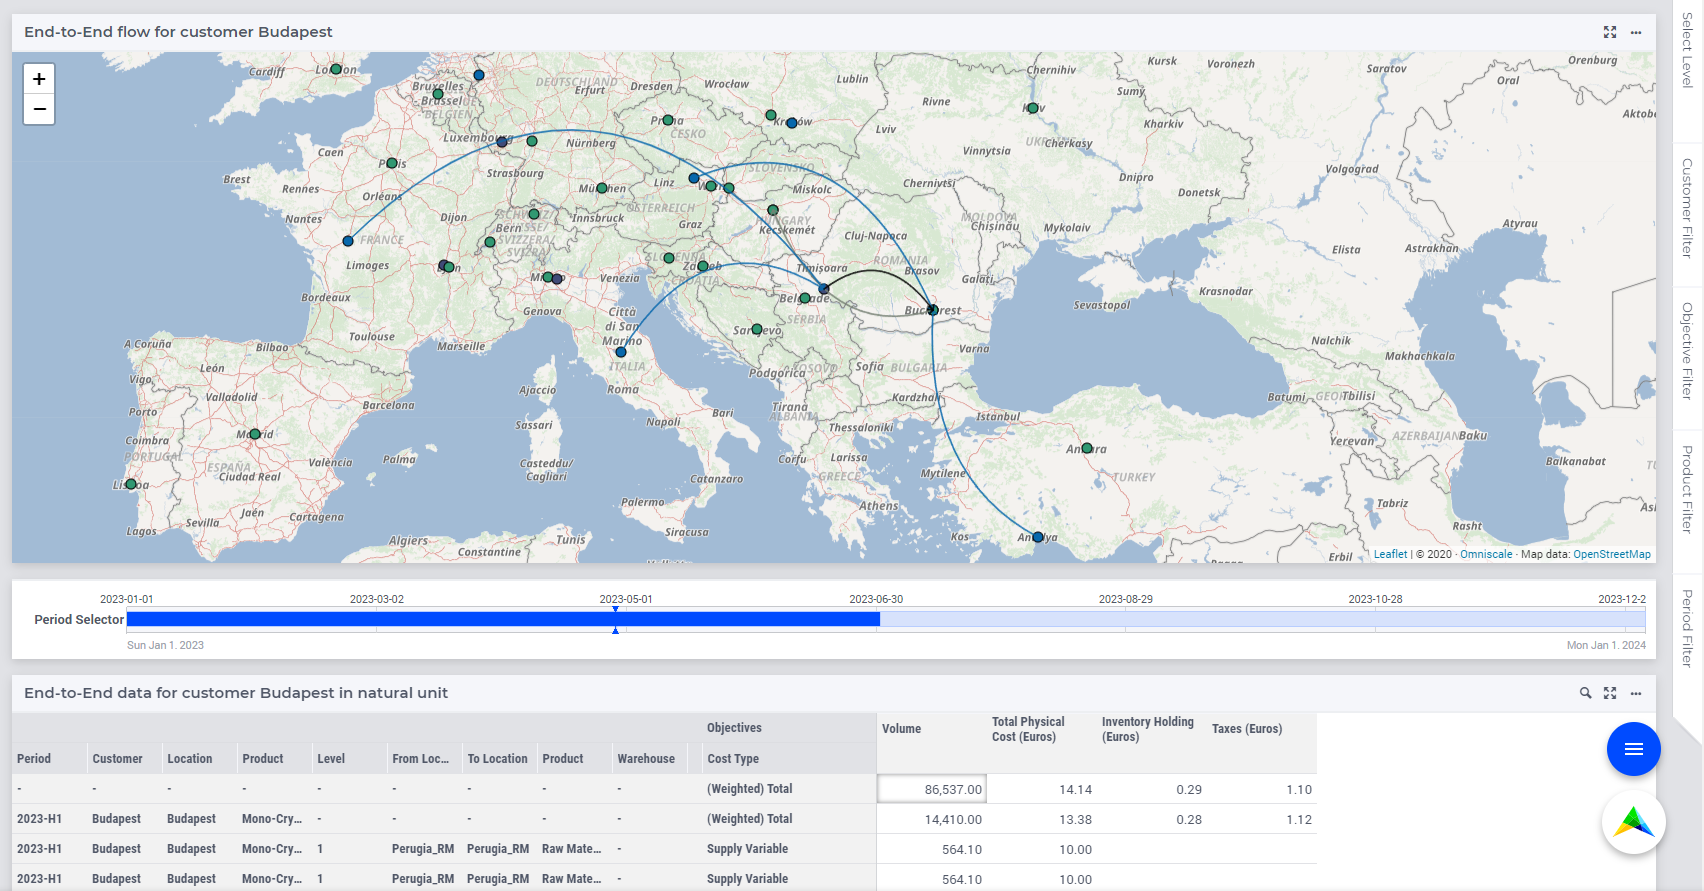
End-to-End flow
On this map you can visualize all the routes going through the selected Supplier, Production Facilities, Warehouses or going to the selected Customer.
For instance, when Customer level and one Customer (namely Budapest) are selected, the map looks as follows:
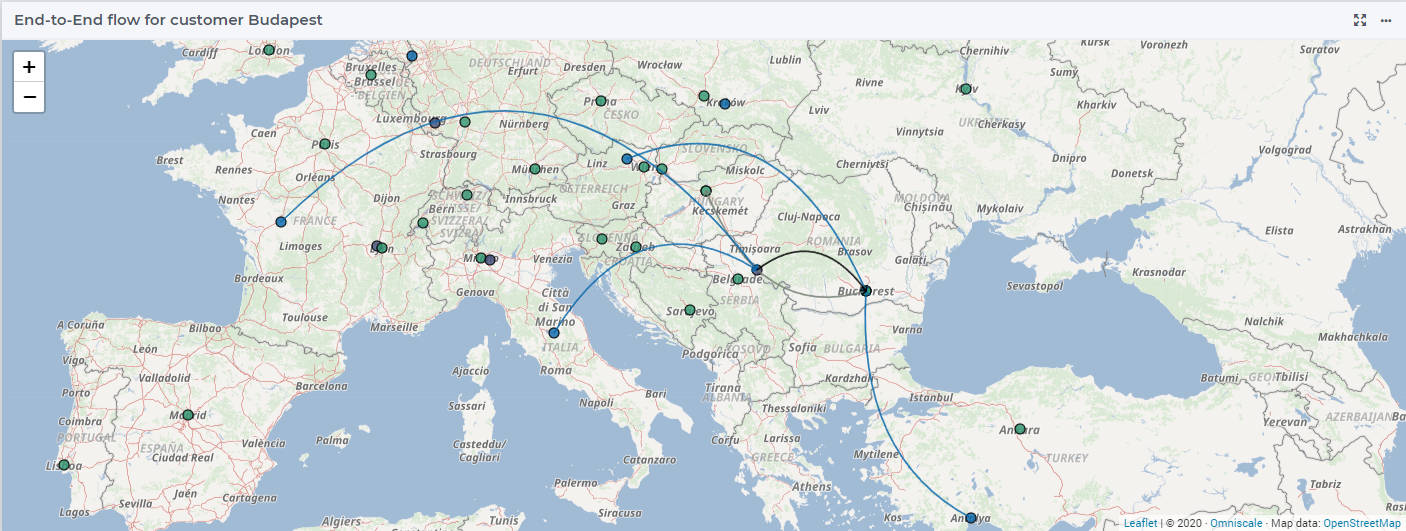
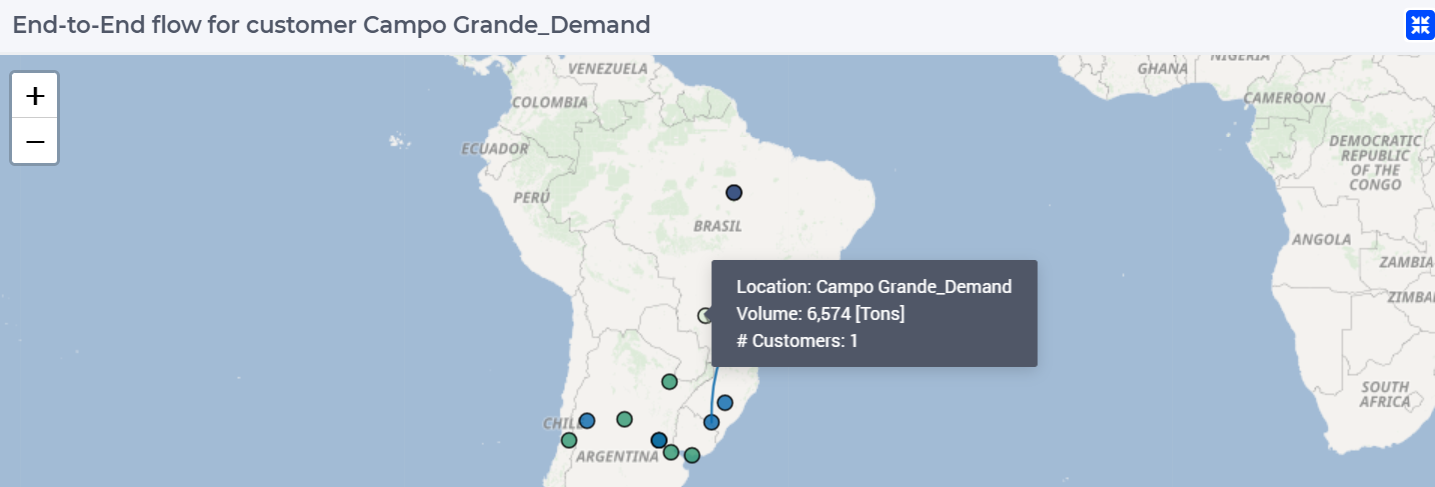
By pointing the cursor on one of the nodes a tooltip can be shown with the most important info of that location: the name of the location, the volume, and the type of the node.
If you select a Customer on the filter side panel you will see all the Suppliers/Productions/Warehouses which are in the supply chain of that Customer.
If you select Suppliers/Productions/Warehouses you will see all the Customers which have that Suppliers/Productions/Warehouses in their supply chain, and all the other Suppliers/Productions/Warehouses which are connected to the originally selected Suppliers/Productions/Warehouses in order to supply the before mentioned Customers.
Overview of Cost Breakdown for All Demand, by route
Basically, this overview shows the same data as the table Overview of Cost Breakdown for All Demand on the page Cost To Serve Results. However, the data are now broken down by the route through which it flows through the network. This allows you to see where and how the costs to serve are incurred.
Each finished good with demand at the given customer constitutes a route, meaning its whole supply chain is broken down in the table, incorporating its production and the flow of the raw materials consumed. In the table, the first Product column is the finished good and the second Product column is the product flowing through the given location.
In this table you can see that every line with cost has an origin and a destination. If the origin and the destination are the same, then the cost (such as supply cost, handling cost, production cost) is incurred at that location. If the origin and the destination are different, then the cost (such as primary cost, secondary cost, inter resource cost) is incurred between the two locations.
If you select a Customer on the filter side panel you will see all the Suppliers/Productions/Warehouses which are in the supply chain of that Customer.
If you select Suppliers/Productions/Warehouses you will see all the Customers which have that Suppliers/Productions/Warehouses in their supply chain, as well as all the other Suppliers/Productions/Warehouses which are connected to the originally selected Suppliers/Productions/Warehouses in order to supply the before mentioned Customers.
The resulting table looks as follows:
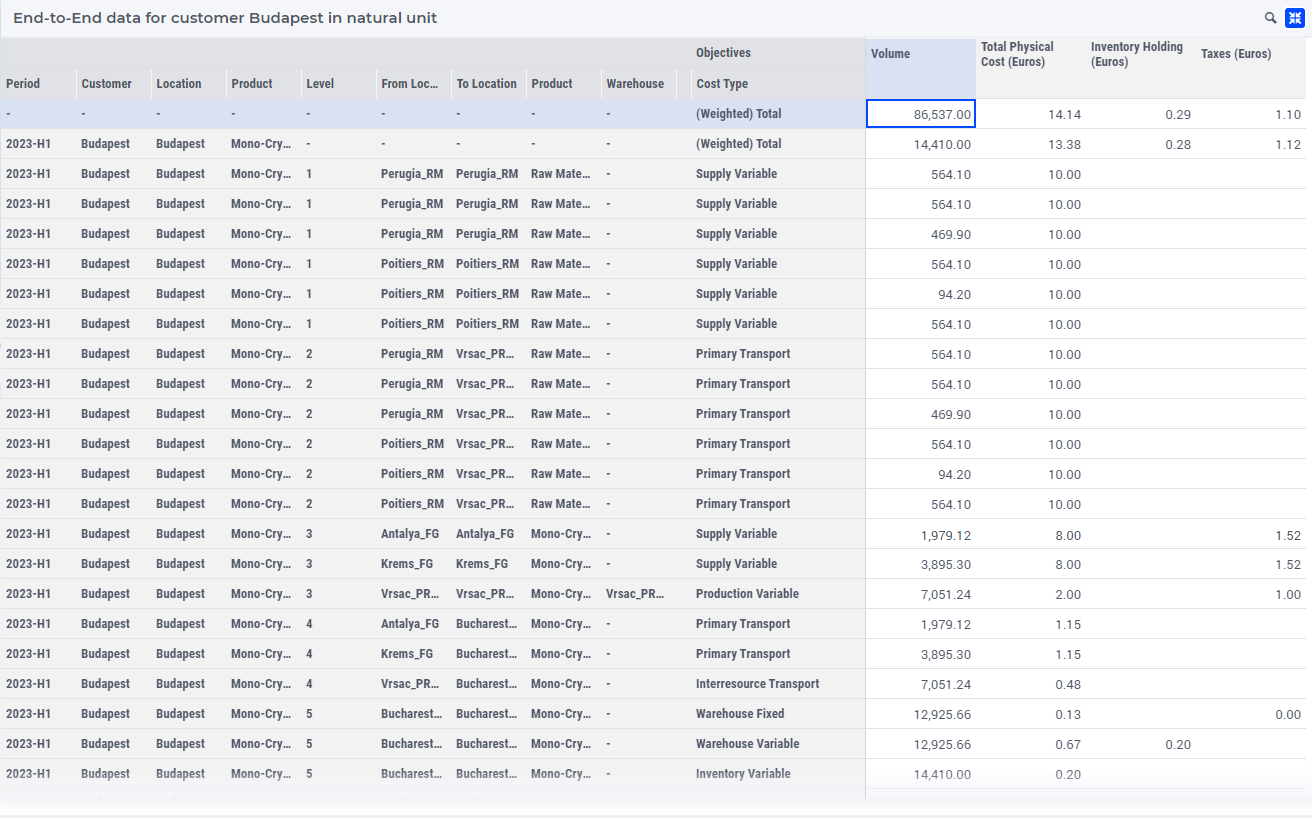
The level number depends on the locations types: a supplier has level 1 and the customer location is the last level. (This order disappears when you are comparing multiple results datasets/cases.)
System cost is always shown on the last level, and it is divided into four categories:
Supply System Cost, containing system cost derived from Supplier Fixed Cost, and Supplier Variable Cost
Production System Cost, containing system cost derived from Production Fixed Cost, and Production Variable Cost
Warehouse System Cost, containing system cost derived from Warehouse Fixed Cost, Warehouse Variable Cost, and Inventory related costs
Transport System Cost, containing system cost derived from Transport related costs
You can also make the table full screen for better visibility, or download it into a file.