Transport Navigator
Transport Navigator is the main page for transport optimization functionality in SC Navigator. Sub-pages in the Transport Navigator module are outlined in the following sections:
Note
The Transport Navigator Module section in How to Use the Application introduces the purpose and benefits of Transport Navigator functionality.
The Getting Started with Transport Navigator section details best practices for getting started with Transport Navigator.
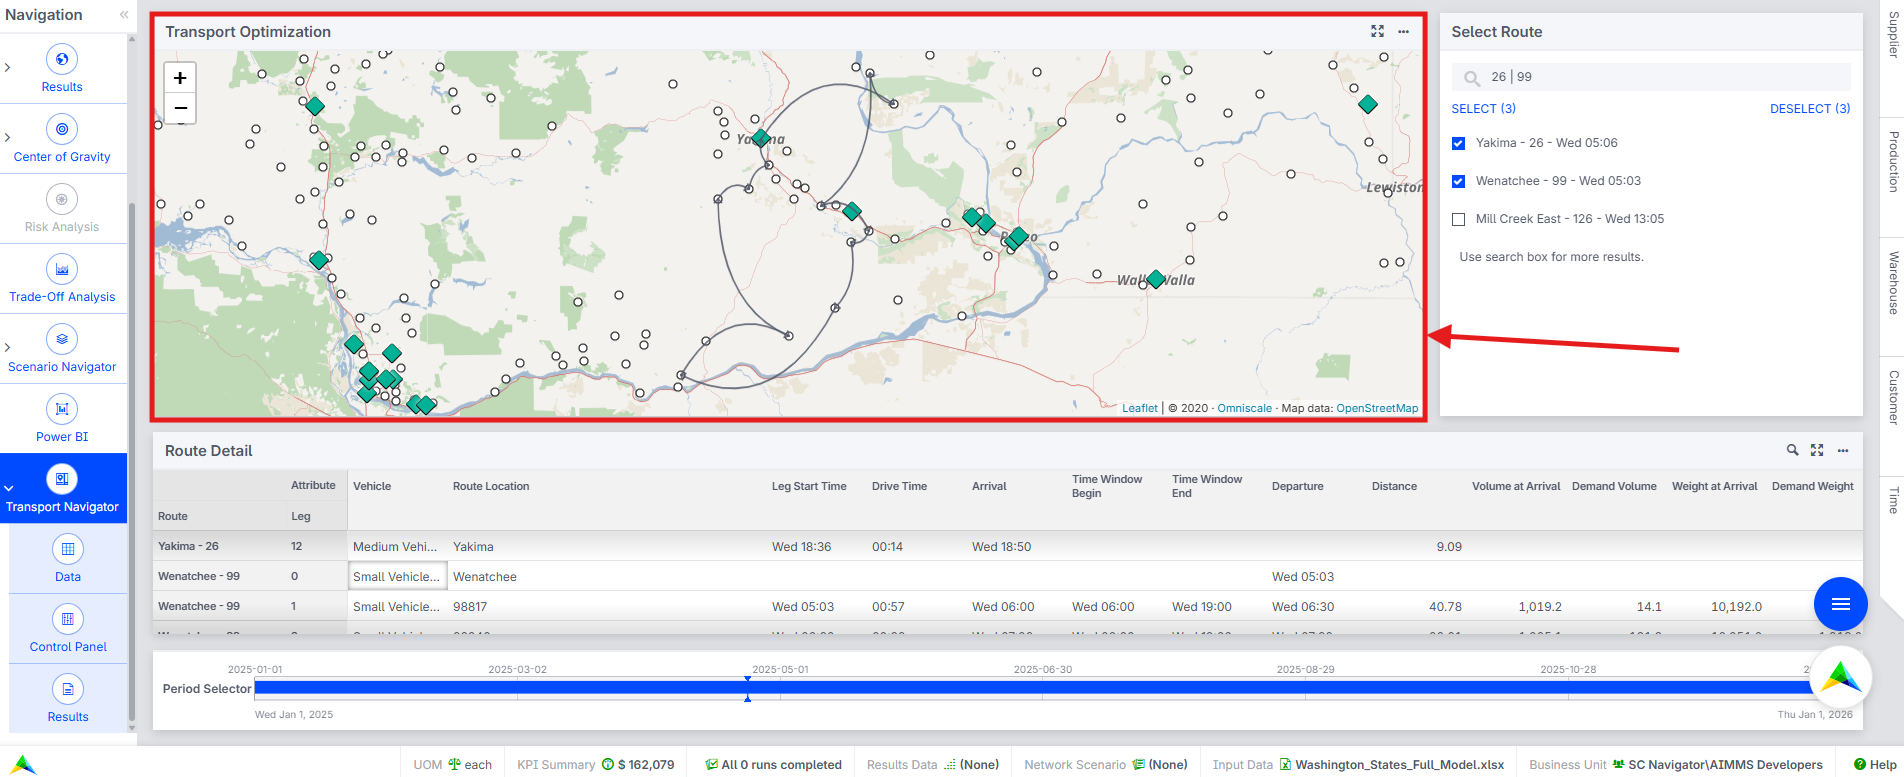
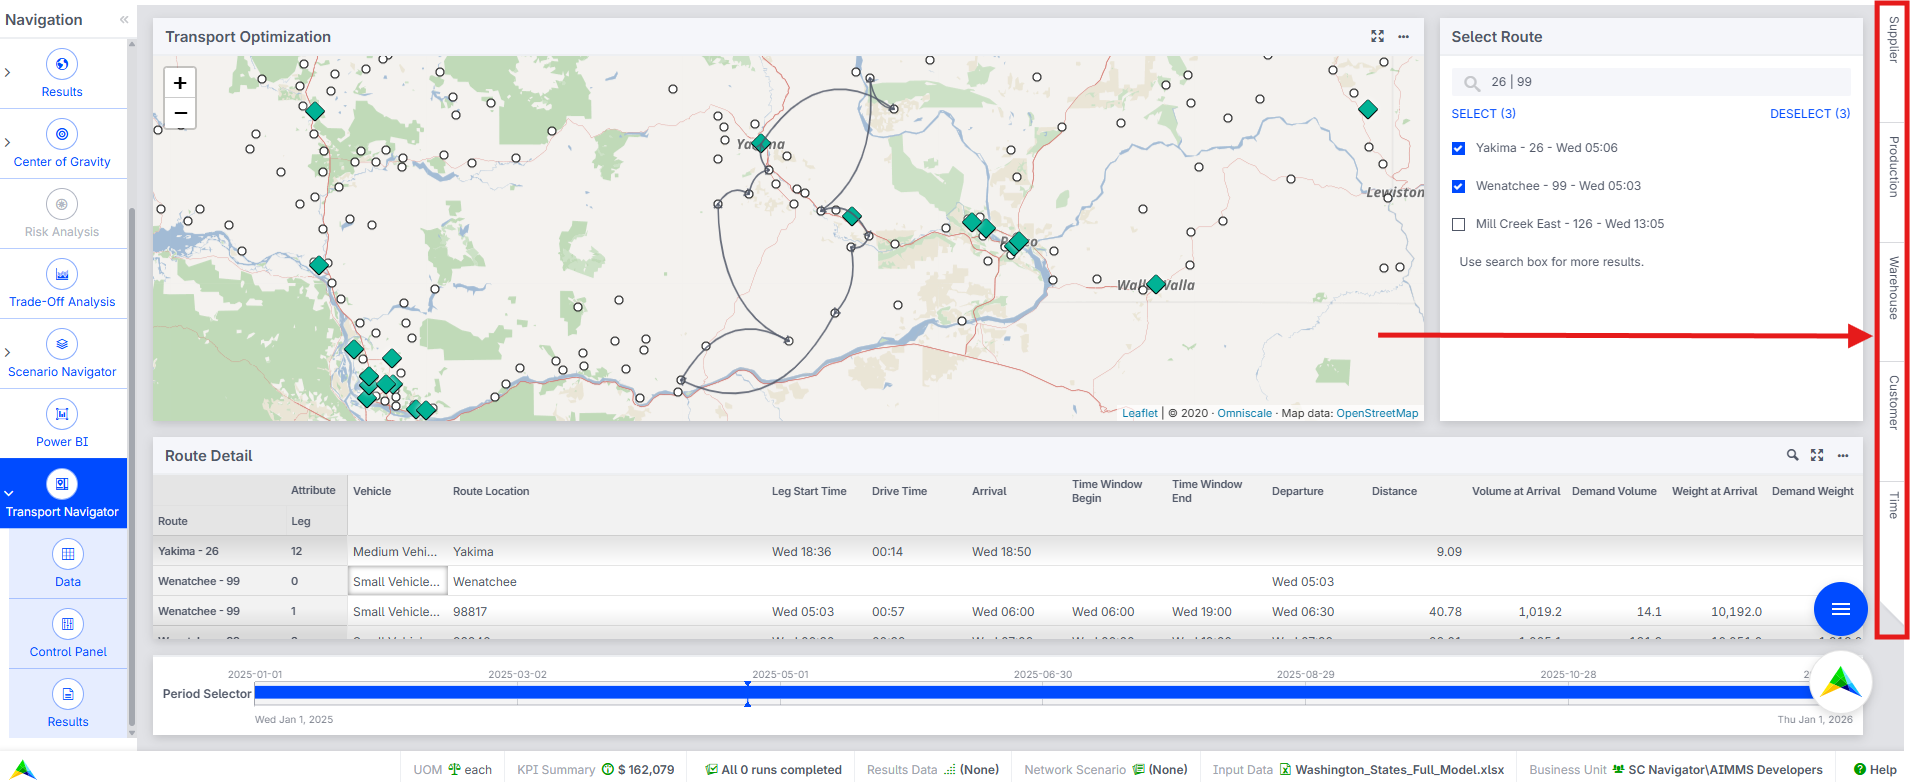
The Transport Navigator page contains four widgets: a map, a route selector list, a route details table, a period selector, and a set of filter side panels.
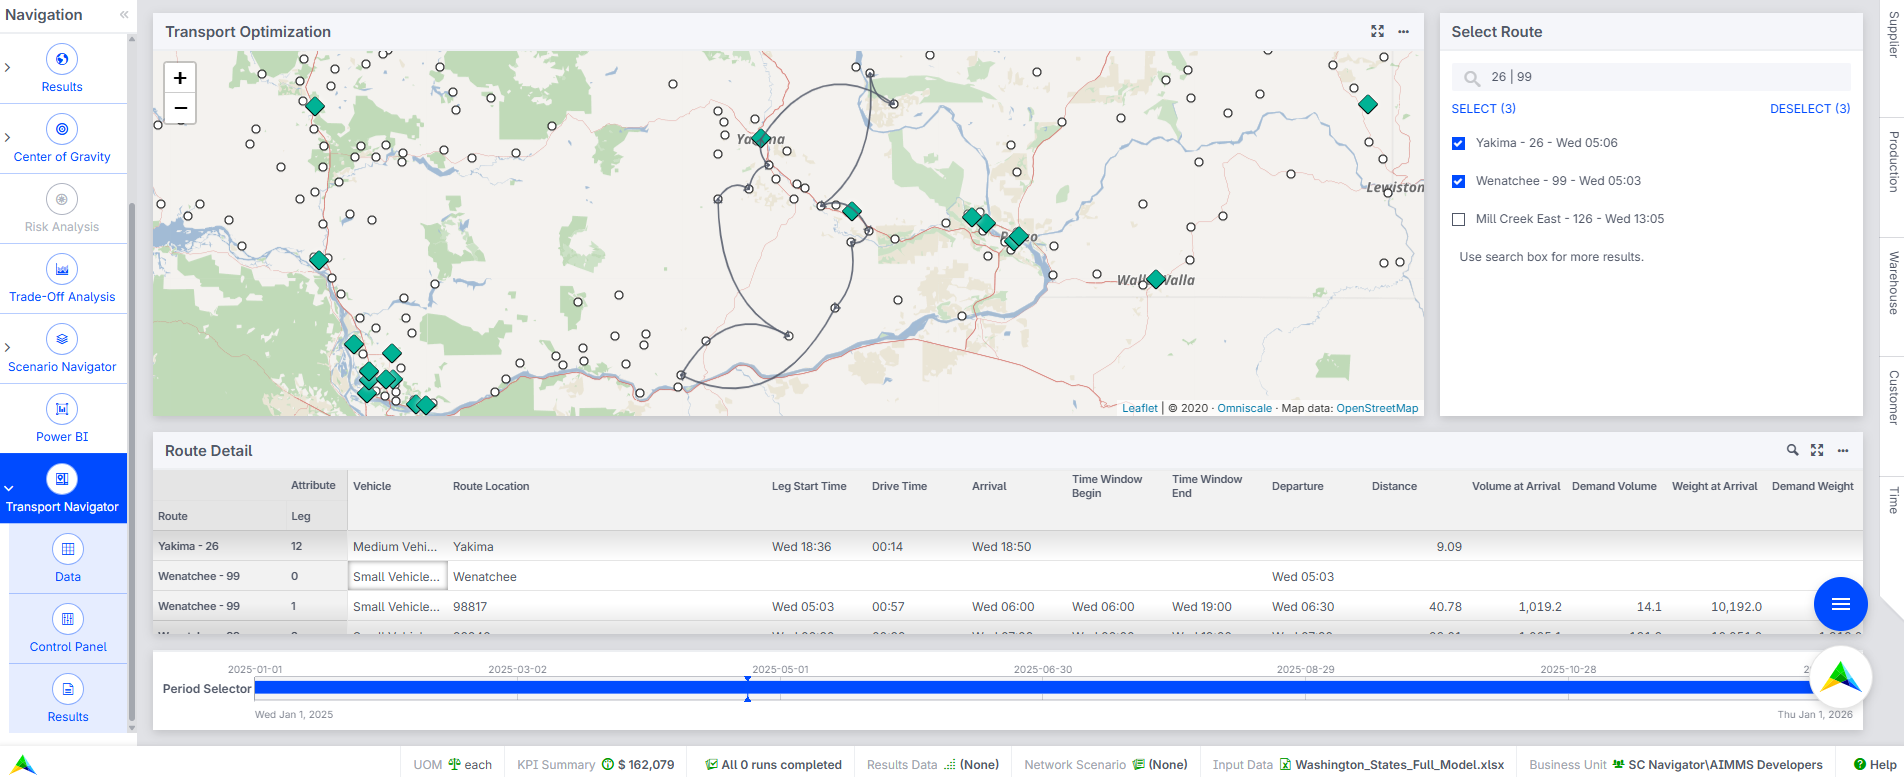
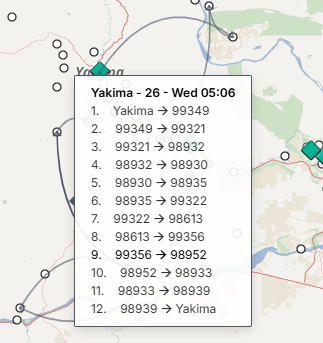
Routes will only be shown on this page when the optimization has been completed. For details on configuring and starting the optimization, refer to Getting Started with Transport Navigator. Once the optimization has run, it is possible to view the routes on the map, and the route details in the Route Details table. Selecting the routes displayed on the map and in the table can be done in two ways: (1) by making a selection in the Select Route widget, or (2) by right-clicking on a customer or warehouse on the map and selecting the Show Routes item action. When using option (2), all routes that service the selected customer will be shown, which can result in multiple route selections. Each route follows a consistent naming format that consists of [Warehouse Name] – [Route Sequence Number] – [Vehicle Departure Timestamp]. When a route is selected, the map will display its path, showing how the vehicle travels from the warehouse to each customer and then returns. Similarly, the Route Detail table will show important data for each leg of the selected routes.
Transport Navigator Map
The map on the Transport Navigator page shows the locations of all suppliers, productions, warehouses, and customers in the supply chain. When a route is selected using either of the options described above, it will be shown on the map.
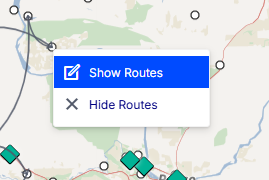
Showing and Hiding Routes via the Map Widget
Selecting routes directly from the map can be done by right-clicking on a warehouse or customer and selecting Show Routes. Similarly, all routes associated with a customer or warehouse can be deselected by choosing Hide Routes in the same option menu, as shown in the image below.
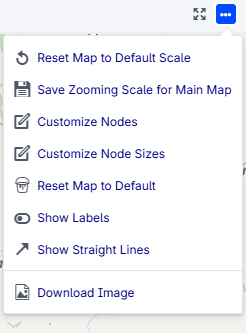
Map Settings
Similar to the main map in SC Navigator, the map in Transport Navigator has several widget options. There is a new option to allow users to choose whether curved or straight lines are shown on the map, depending on their preference. Toggling labels on and off will either show or hide the leg number on each arc, respectively.
Route Details on the Map
When a trip is shown on the map, hovering over a leg (single arc on the map) shows more information about the route. The image below shows that the user is hovering over leg 9 of route Yakima - 26 - Wed 05:06, and that in this leg the vehicle is traveling from customer 99356 to customer 98952.
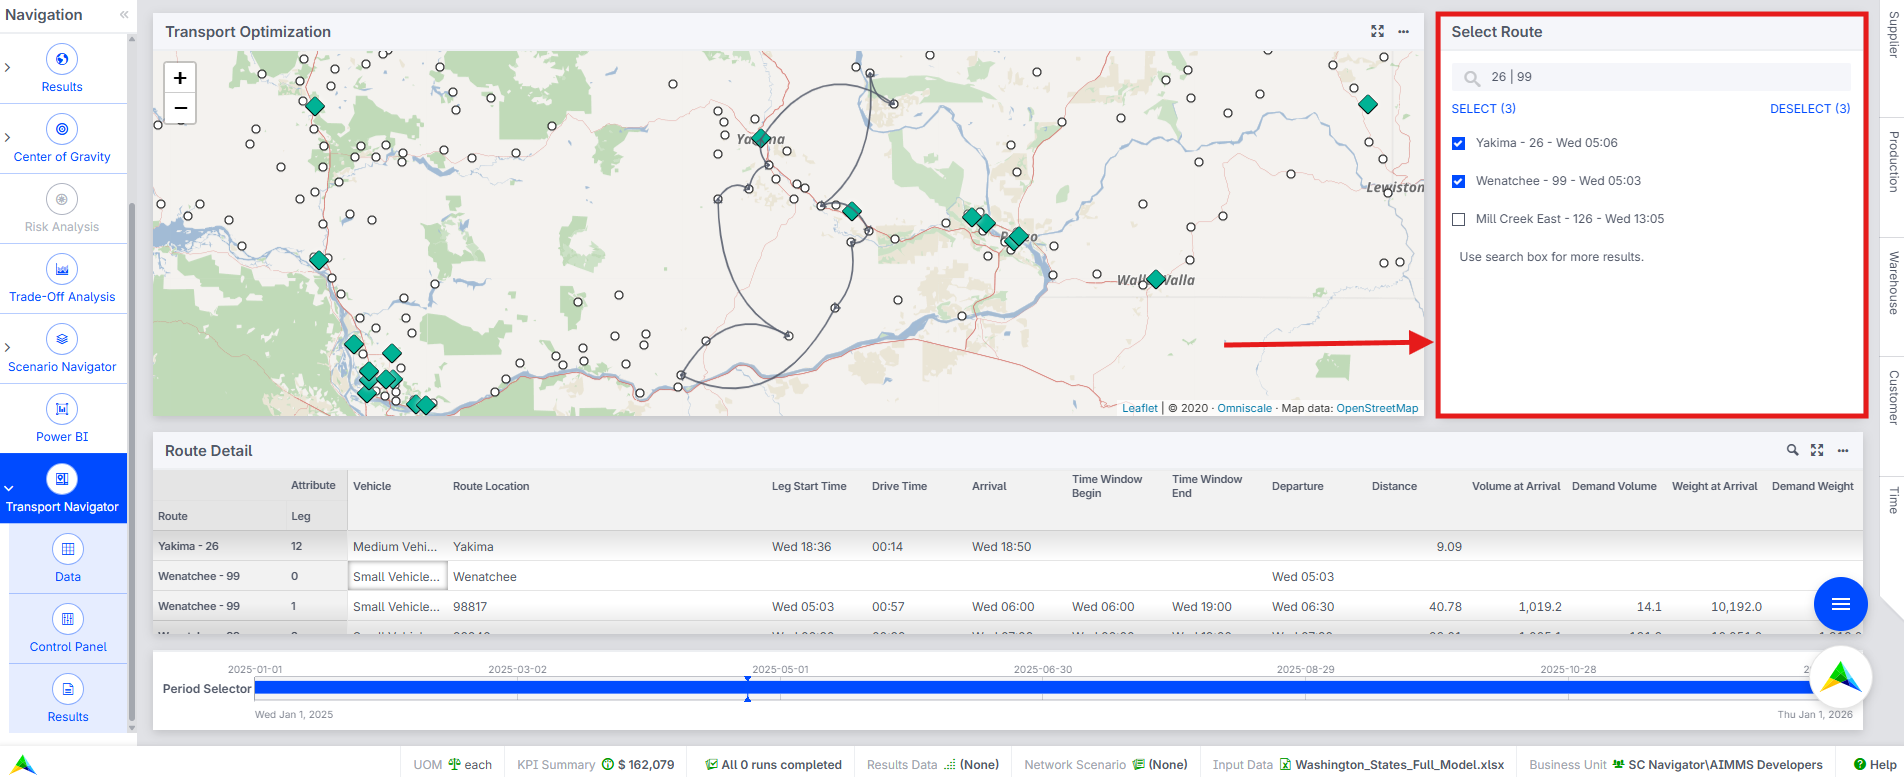
Select Route
The Select Route widget can be used to choose which routes are shown on the map and in the Route Details widget. The search bar at the top of the widget can be used to find a specific route, or a set of routes. All routes can be selected or deselected by clicking on SELECT or DESELECT under the search bar.
Route Details
The Route Details widget shows important data for each leg of the selected routes.
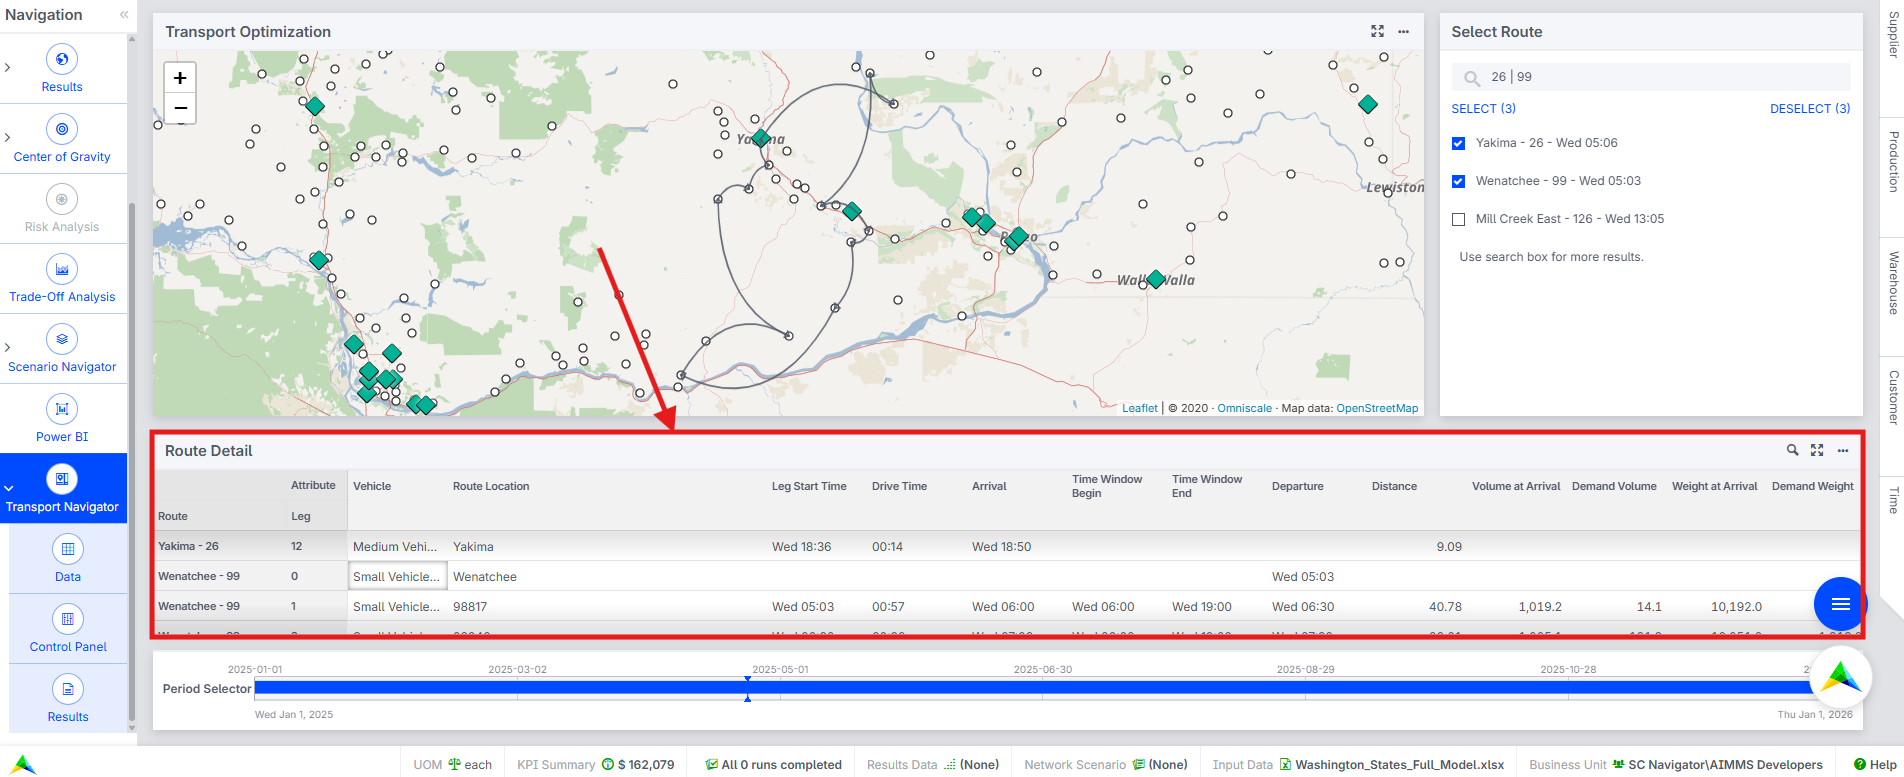
The table below indicates what data is provided in the Route Details widget.
Field |
Description |
|---|---|
Vehicle |
The vehicle’s name that performs this leg/route. |
Route Location |
The destination location of this leg. |
Week |
The week number of the year for this delivery. |
Leg Start Time |
The timestamp when the vehicle departs from the previous stop. |
Drive Time |
Time taken to travel from the previous stop to the current one. |
Arrival Time |
The timestamp when the vehicle arrives at this Route Location. |
Time Window Begin |
The earliest allowed delivery time for this customer. |
Time Window End |
The latest allowed delivery time for this customer. |
Departure |
The timestamp when the vehicle departs this location. |
Distance |
The distance from the previous Route Location to this one. |
Volume at Arrival |
The volume carried by the vehicle when arriving at this location. |
Demand Volume |
The demand in volume required by this customer. |
Weight at Arrival |
The weight carried by the vehicle when arriving at this location. |
Demand Weight |
The demand in weight required by this customer. |
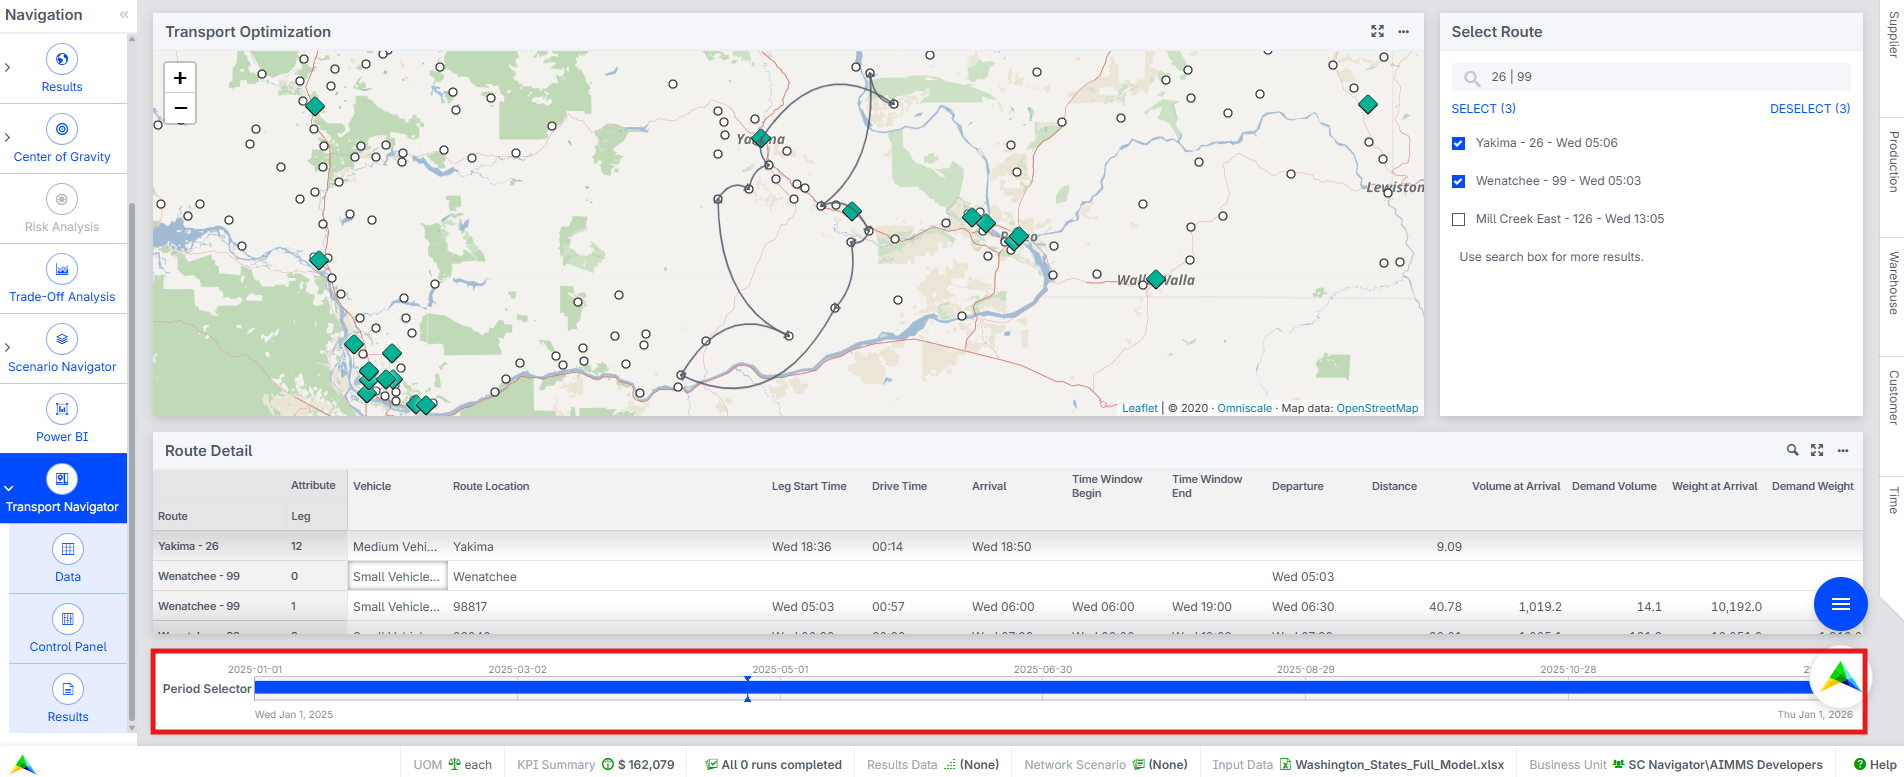
Period Selector
The Period Selector can be used to filter the data displayed on the page by period. This can be useful if you are dealing with a multi-period model and wish to easily change which results are currently shown on the screen.
Filter Side Panels
Just like Filtering in SC Navigator, data shown on the Transport Navigator page can be filtered by using the side panels. The following filter side panels are included:
Supplier and Production Filters - select which suppliers and productions are shown on the map.
Warehouse Filter - select which warehouses are shown on the map and which routes can be shown based on their originating warehouse.
Customer Filter - select which customers are shown on the map and displays only the routes that serve them.
Time Filters:
Dispatch Day Filter to narrow down the routes based on their departure day. When applied, it not only filters the available routes in the selection widget but also limits the displayed customers on the map to those whose deliveries are part of routes departing on the selected day. For instance, if you filter on Friday, the system might reduce the list to 50 routes, and only customers associated with those routes will remain visible.
Delivery Day Filter to select routes and customers based on their scheduled delivery day. When applied, it limits both the routes in the selection widget and the customers on the map to those scheduled for delivery on the selected day. For example, choosing Wednesday may display 66 routes and show only the customers receiving deliveries on Wednesdays.
To help visualize these selections, you can enable color coding on the map based on either dispatch day or delivery day. Only one color mode can be active at a time - enabling one will automatically turn off the other.
Time Window Filter to allow users to adjust a slider to display only customers whose delivery time windows fall within a specific range, such as mornings or afternoons.
KPI Summary
A summary of KPIs for the solution is given in the KPI Summary dialog, which can be opened from the status bar. The KPI Summary is divided into three sections: Cost, Service, and Vehicle. Note than in the case of multi-period SC Navigator data, the KPIs are averaged across all periods.
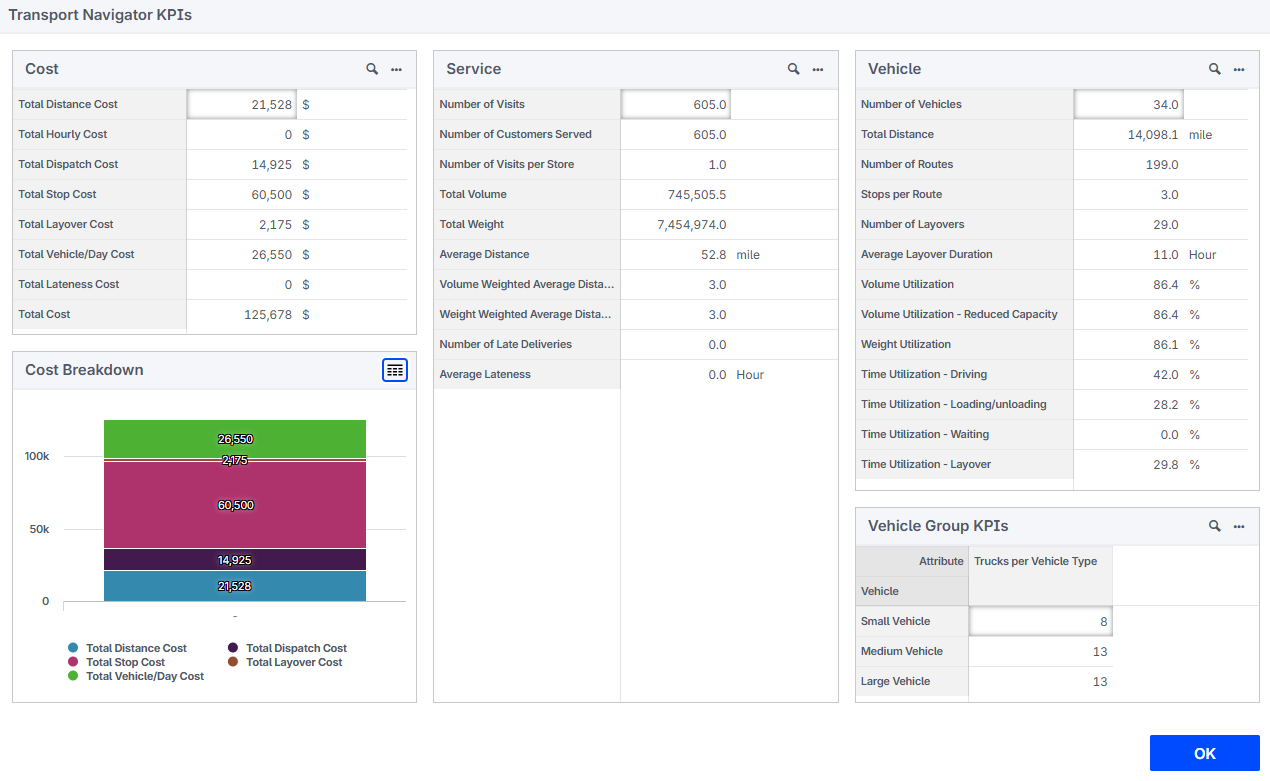
In the Cost section, the following cost buckets are shown, each being the sum of their associated cost type:
Total Distance Cost
Total Hour Cost
Total Dispatch Cost
Total Stop Cost
Total Layover Cost
Total Vehicle Fixed Cost
Total Lateness Cost
Total Cost
These costs are presented in the Cost Breakdown visual, below the Cost KPIs.
In the Service section, the following KPIs are shown:
Field |
Description |
|---|---|
Number of Visits |
The total number of stops made across all routes (excluding warehouses). |
Number of Customers Served |
The number of unique customer locations that received at least one delivery. |
Number of Visits per Store |
The average number of visits made per customer location. |
Total Volume |
The total volume of goods delivered across all routes. |
Total Weight |
The total weight of goods delivered across all routes. |
Average Distance |
The average distance traveled per route. |
Volume Weighted Average Distance |
The average route distance weighted by the volume of goods delivered. |
Weight Weighted Average Distance |
The average route distance weighted by the weight of goods delivered. |
Number of Late Deliveries |
The count of deliveries that arrived after the specified time window. |
Average Lateness |
The average delay of late deliveries beyond their allowed time windows. |
In the Vehicle section, the following KPIs are shown:
Field |
Description |
|---|---|
Number of Vehicles |
The total number of unique vehicles used across all routes. |
Total Distance |
The cumulative distance traveled by all vehicles. |
Number of Routes |
The total number of distinct delivery routes generated. |
Average Number of Stops per Route |
The average number of stops made on each route. |
Number of Layovers |
The total number of layovers required due to duty or drive time limits. |
Average Layover Duration |
The average time spent on each layover. |
Volume Utilization |
The average proportion of volume capacity used across all routes. |
Volume Utilization - Reduced Capacity |
The average volume utilization after accounting for per-stop capacity reductions. |
Weight Utilization |
The average proportion of weight capacity used across all routes. |
Time Utilization - Driving |
The average proportion of time spent driving. |
Time Utilization - Loading/unloading |
The average proportion of time spent loading or unloading goods. |
Time Utilization - Waiting |
The average proportion of time spent waiting. |
Time Utilization - Layover |
The average proportion of time spent on layovers relative to total duty time. |
Additionally, the Vehicle section contains an additional table named Vehicle Group KPIs if vehicle groups are used. This table shows how many vehicles per vehicle group are used.