Save and Compare Results
How to save results dataset?
On many pages you can find a Save As (…) Data dialog similar to the Load Data dialog. The Save As Results Data dialog page consists of three parts. In the first part you enter the details of the element to be created, while in the second part you see an overview of the existing datasets.
The first part consists of a widget to enter the Name and the Description.
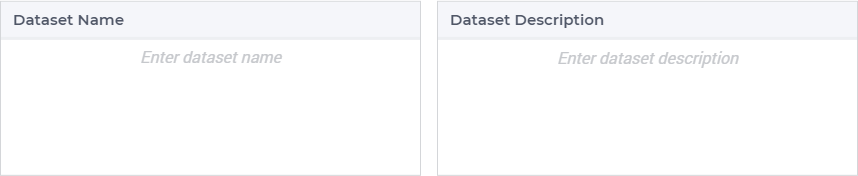
The length of the name must be less than 64 characters. We recommend keeping it short, but still provide some useful information in the name. Furthermore, use the description in order to provide more details, so that the next time you see this name and this description, you know what it is about.
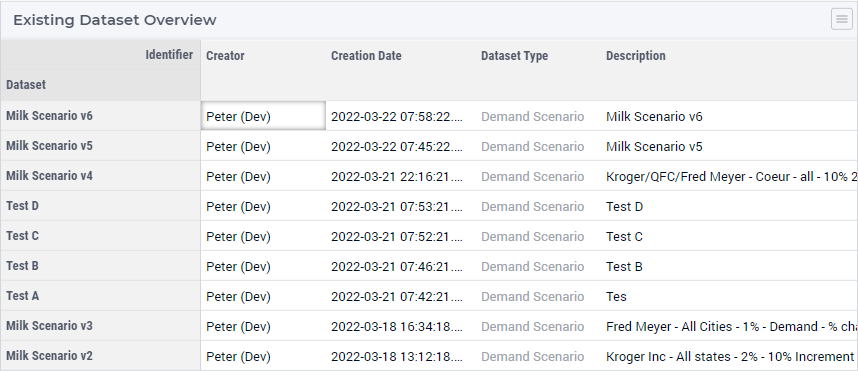
The middle part of the screen shows all the existing datasets. The purpose of showing these is two-fold:
It helps you to see which names have been already used.
It helps you to keep up a certain naming structure.
The last parts is a series of buttons that allow for some export related actions:

Download Solution
The first button is Download Solution which can be used to download the results. The behavior of this buttons depends on the situation, this behavior has changed in version 24.5.1:
If multiple results datasets are being compared, a single file with the data of all these results datasets will be created. The name of the results dataset will be the value of the (new) column “Results”.
If only one dataset is loaded and a “Result Name” is specified, a single file with the data of the current dataset will be created and the specified name will be the value for the (new) column “Results”.
In all other cases, an Excel file will be generated that does not have the (new) column “Results”.
Download E2E Report
The next button is Download E2E Report which can be used to download the E2E Report. Normally the E2E report is included in the Excel file that is downloaded via Download Solution. However, Excel has a limit of about 1 million rows and if we have more than 1 million rows, the E2E report is not included, but can be downloaded separately as a csv file via this button.
Export To Data Lake
The next checkbox Export To Data Lake can be used to indicate if the results need to be stored in the data lake. Every time you save the results, an element in this list is created, together with a binary file containing all the data, which can be loaded back. However, if you want to make these results available outside the application in the data lake, you will need to check this box.
Results visible to everyone
The last checkbox Results visible to everyone can be used to indicate that other users should be able to load the results you are about to create.
How to Compare
This page discusses the functionality which allows to save and then compare different results datasets in the application.
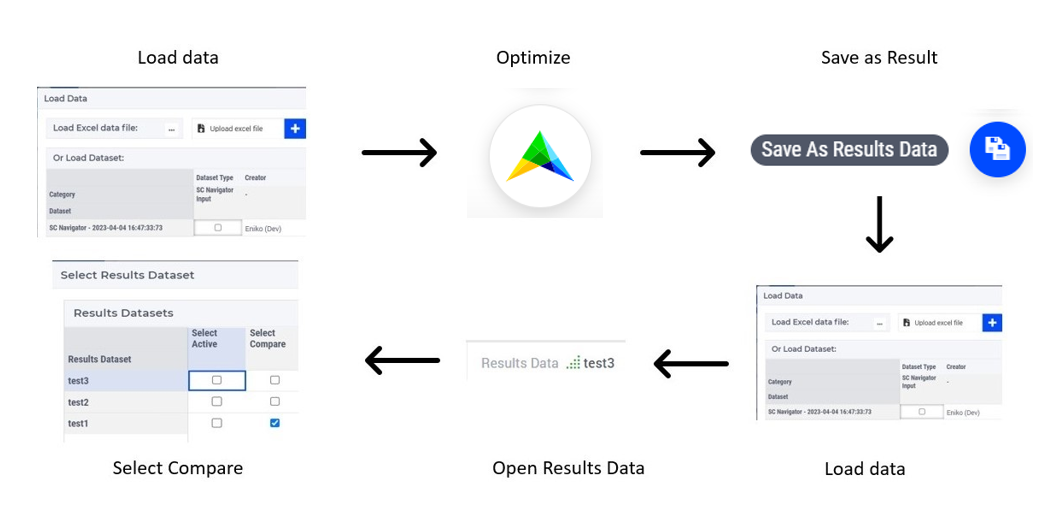
You can compare results from the status bar as follows:
Load the first dataset using the action Load Data Dialog
Optimize
Save Results dataset by clicking on the page actions icon
Load the second dataset
Optimize
Save Results dataset by clicking on the page actions icon
Click on the Result Data button on the status bar
For the first results dataset choose the Select Compare option and for the second choose the Select Active option
Now the second results dataset will be the active results dataset and the first results dataset is compared to it.

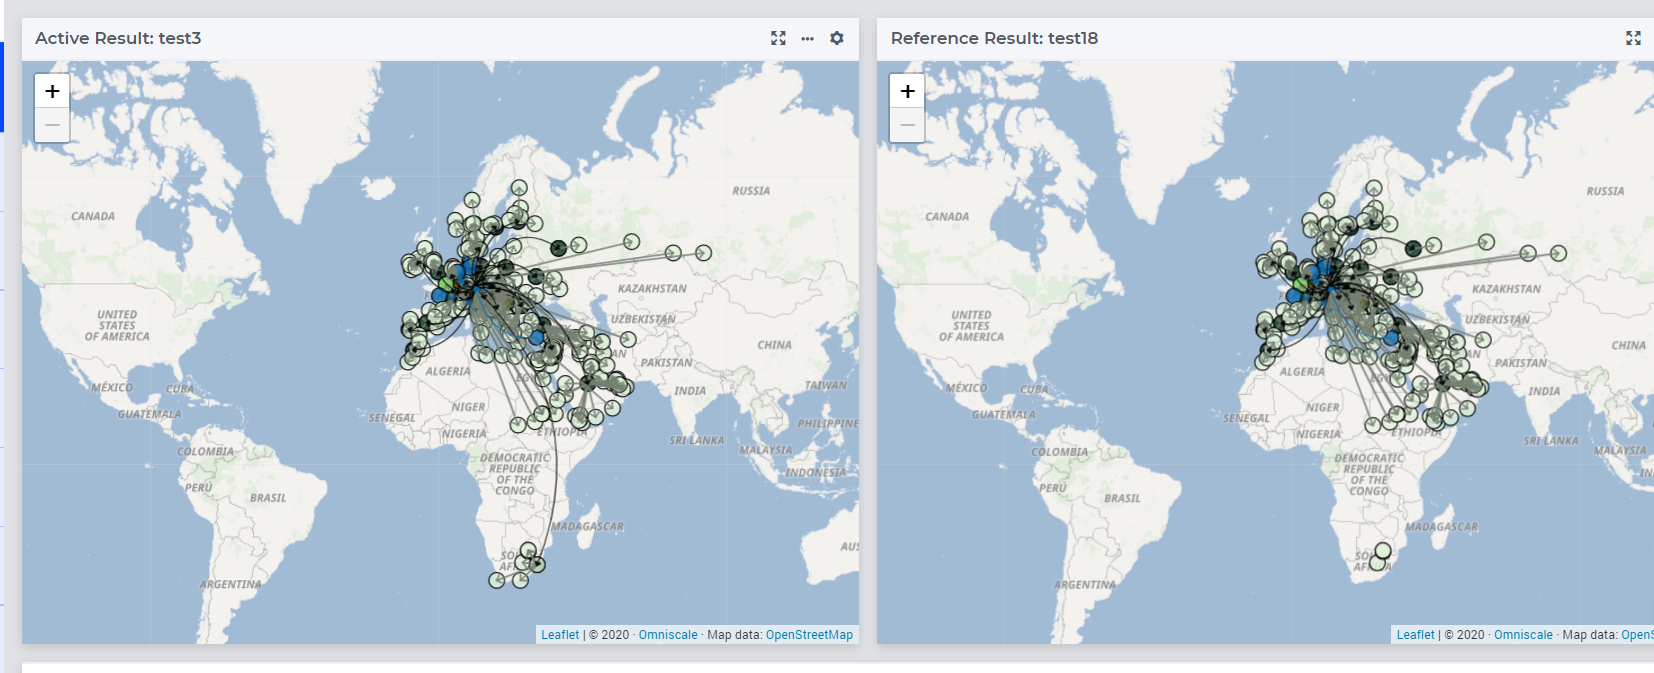
On the Results page (opened from the Results Data on the Status Bar), you can tick the Select Reference Map column to visualize the results not only the active results dataset, but also for the reference case:
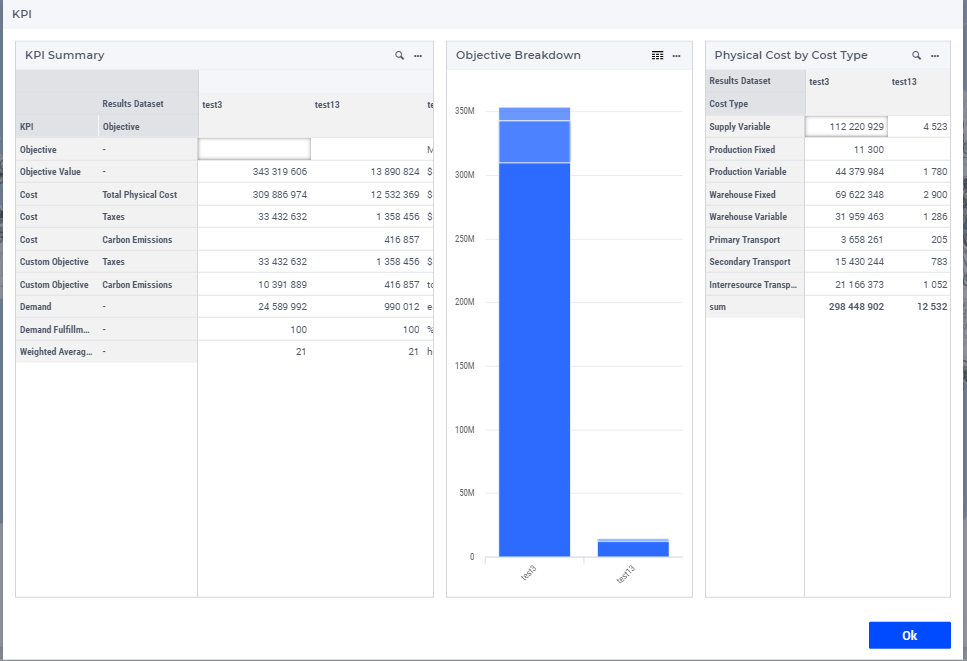
On the KPI Summary dialog page (which is reachable from the Status Bar), you can compare the results of the two datasets.
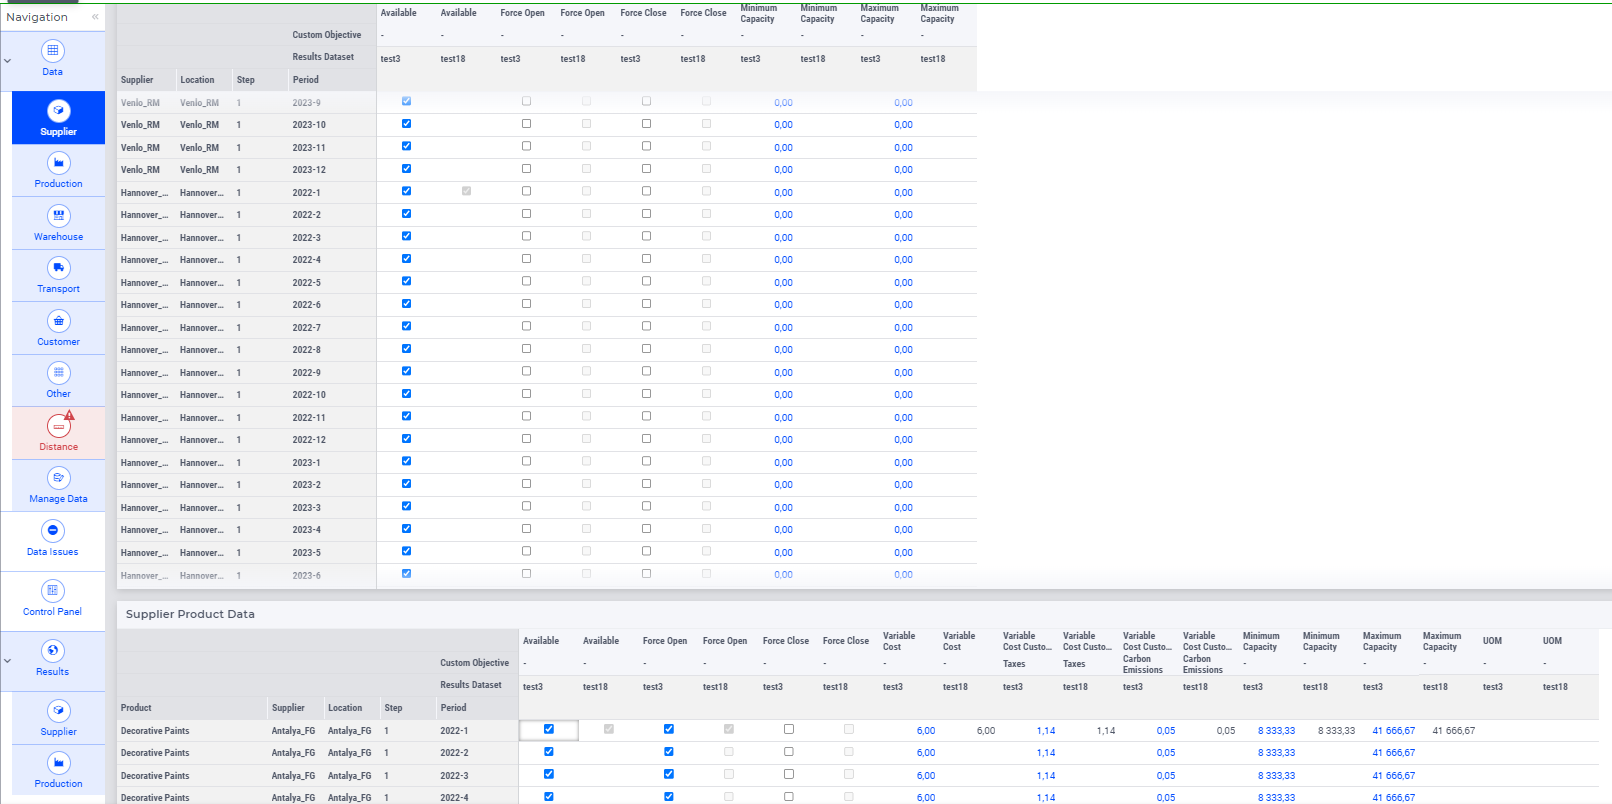
After you have selected the active results dataset and the results dataset to compare, you can review the input data on the Data pages for both datasets, while the results for the two datasets can be seen on the Results pages.
For example, on the Supplier Data page you can compare the supplier related input data and you can also modify the input data selected for Active.
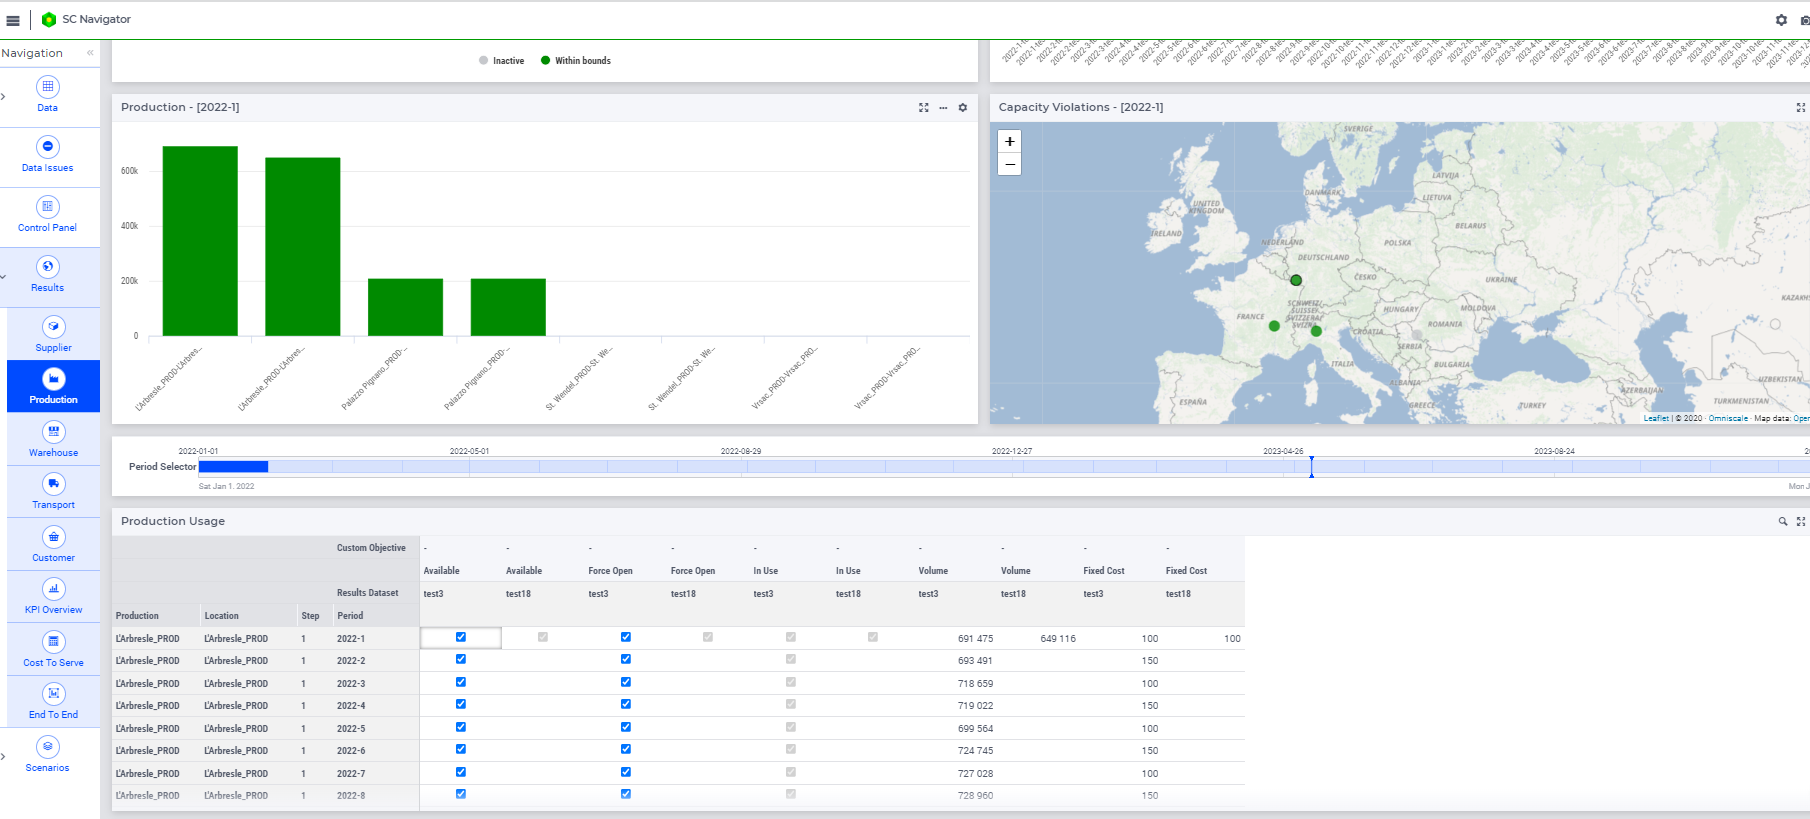
Another example is the Production Results page, where you can overview the production related data for all results datasets:
If you have already selected some results datasets, but you want to select new ones, then the results dataset dialog page can be opened using the Results Data button on the Status Bar.

Here you can review the results datasets which are currently saved in the database.
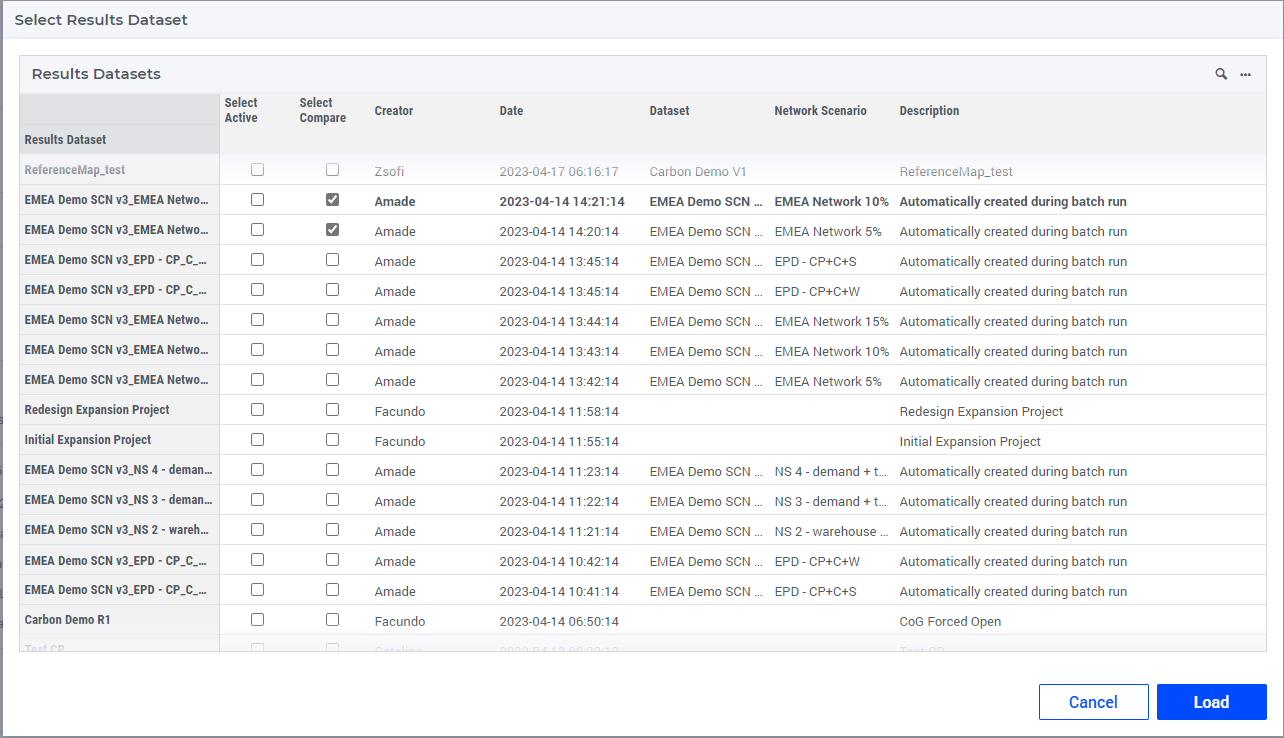
By clicking the checkbox in the Select Compare column, you can select the results datasets which you want to compare. By clicking the checked checkbox in the Select Compare column, you can deselect the results datasets which you want to remove from the comparison.
To get a high level comparison of the results datasets and see more detailed differences, go to the Compare Results page.