Results
The Results page contains four tabs that provide more detailed information on the results of a Transport Navigator optimization: Charts, Route Summaries, Route Details, and Vehicles.
Note that a high-level summary of results can be found in the KPI Summary, accessed from the status bar.
Charts
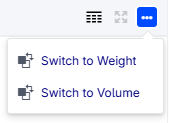
The Charts tab contains four visualizations. The charts in the first row can be toggled between Volume, Weight, Effort and Vehicles by the widget action shown below.
In either of the two top charts, you can click on a bar. This results in the two bottom charts to show the data of the selected location/period bar in a more detailed way. The X-axes of the bottom charts denote the hours elapsed since the start of the selected period. In case your periods start and end at midnight, these coincide with the hours on the clock (so, hour ‘2’ would then mean the time span between 02:00 and 03:00).
Field |
Description |
|---|---|
Volume/Weight/Effort/Vehicles Dispatched |
Total volume, weight, effort or number of vehicles dispatched per warehouse for each TN Period. The same vehicle can be dispatched multiple times in the same period, thus being counted more than once. |
Volume/Weight/Effort/Vehicles Delivered |
Total volume, weight, or effort delivered or number of vehicles operating per warehouse for each TN Period. |
Volume/Weight/Effort/Vehicles Dispatched per hour |
Dispatches per warehouse per TN period hour |
Volume/Weight/Effort/Vehicles Delivered/Operating per hour |
Delivery per warehouse per TN period hour or number of vehicles operating on at least one route, per warehouse per TN Period hour. |
Route Distribution
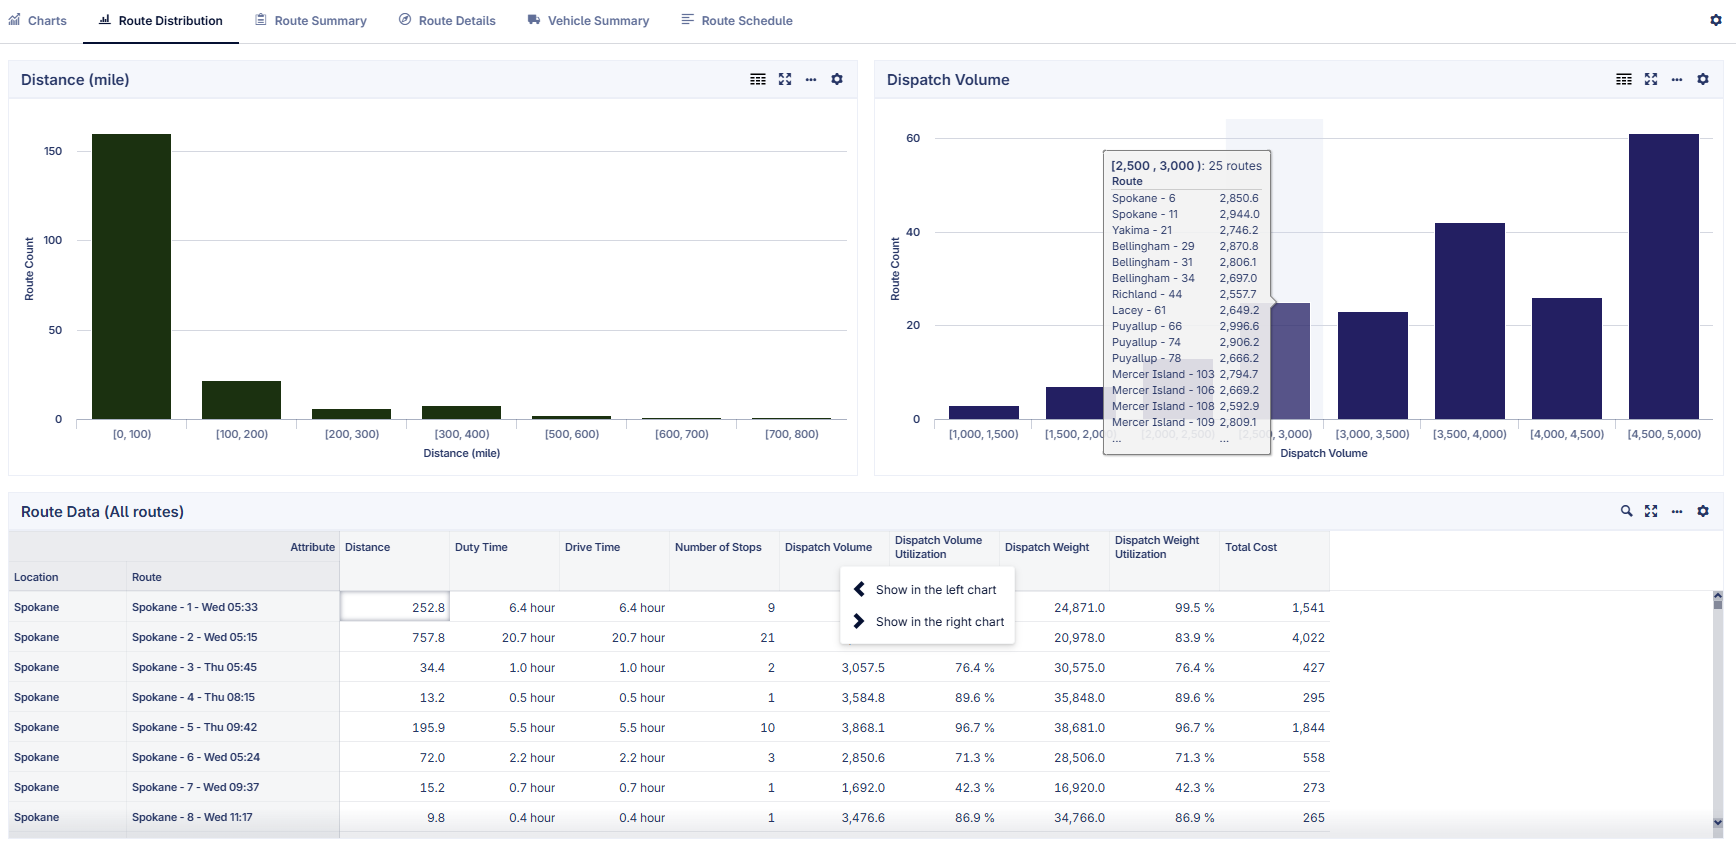
The Route Distribution page provides a clear way to explore route performance across key attributes. It combines interactive histograms with a detailed data table for deeper insights.
Top Section: Two histogram areas for visualizing data distributions.
Bottom Section: A detailed data table listing routes and their attributes.
Histograms
Each histogram represents the distribution of a selected attribute, such as distance, dispatch volume, or utilization. The x-axis shows interval ranges, and when interval is larger than 1000 the ranges are displayed in “k” format (for example, 2000 -> 2k). Users can click on any interval to filter the table below so that it only displays the routes included in that range. To provide additional context, hovering over an interval opens a tooltip listing the routes in that interval, along with their data. For readability, only the first 15 routes appear in the tooltip. If more routes are included, an ellipsis (”…”) appears at the bottom of the tooltip to indicate additional items.
Data Table
The data table is interactive and works closely with the histograms. By default, it shows data for all routes, but users can click on an histogram interval above to only see data of the included routes. When the data table is filtered, users can toggle the widget action “Show all” to see all data. The table also allows switching attributes to be displayed in the two histograms: right-clicking an attribute header lets users choose which attribute to display in either the left or right histogram. This makes it easy to compare two different attributes side by side.
Route Summary
The Route Summary tab contains results associated with each route, aggregating these results over all legs. The following information can be found for each route in the Routes table:
Field |
Description |
|---|---|
Vehicle |
The vehicle used for the given route. |
Departure Time |
Time of departure for the route. |
Arrival Time |
Time of arrival at the warehouse once the route has been completed. |
Distance |
Total distance traveled in the route. |
Duty Time |
Time spent by the driver on working activities. This is ‘Driving time’ + ‘Service Time’ + ‘Waiting Time’ + time at the depot in between trips. |
Driving Time |
Time spent on the road driving. |
Number of Stops |
Total number of stops made during the trip, equal to the number of customers visited. |
Dispatch Volume |
Volume of the load at departure from the warehouse. |
Dispatch Volume Utilization |
Percentage of the vehicle’s available volume capacity used at departure. |
Dispatch Weight |
Weight of the load at departure from the warehouse. |
Dispatch Weight Utilization |
Percentage of the vehicle’s available weight capacity used at departure. |
Distance Cost |
Total cost contribution from distance-based costing for the route. |
Hour Cost |
Total cost contribution from hour-based costing for the route. |
Stop Cost |
Total cost of stops over the route. |
Dispatch Cost |
Cost of dispatching the vehicle from the warehouse. |
Layover Cost |
Cost for layovers during a route. |
Vehicle Fixed Cost |
Cost for using the vehicle type for a route. |
Lateness Cost |
Cost for the accumulated time where a vehicle arrives after a customer’s specified time window over a route. |
Total Cost |
Total cost over all cost buckets. |
Route Details
The Route Details tab displays results for each route and route leg. This table mirrors the Route Details table found on the Transport Navigator page in terms of information provided, the difference being that it includes all routes instead of just the ones highlighted on the map. The following results can be found on the Route Details tab for each route-leg combination:
Field |
Description |
|---|---|
Vehicle |
The vehicle’s name that carries this leg/route. |
Route Location |
The destination location of this leg. |
Week |
The week number of the year for this delivery. |
Leg Start Time |
The timestamp when the vehicle departs from the previous stop. |
Drive Time |
Time taken to travel from the previous stop to the current one. |
Waiting Time |
Time spent waiting until the delivery window opens. |
Lateness |
Time between the vehicle arrival and the end of the time window. |
Layover Duration |
Time spent in a long break, typically overnight. |
Arrival Time |
The timestamp when the vehicle arrives at this Route Location. |
Time Window Begin |
Earliest allowed delivery time for this customer. |
Time Window End |
Latest allowed delivery time for this customer. |
Departure |
The timestamp when the vehicle departs this location. |
Distance |
The distance from the previous Route Location to this one. |
Volume at Arrival |
The volume carried by the vehicle when arriving at this location. |
Demand Volume |
The demand in volume required by this customer. |
Weight at Arrival |
The weight carried by the vehicle when arriving at this location. |
Demand Weight |
The demand in weight required by this customer. |
Vehicle Summary
The Vehicle Summary tab shows results for each vehicle over all legs and routes. The following results can be found on the Vehicle Summary tab for each vehicle:
Field |
Description |
|---|---|
Volume Utilization |
Average ratio of used to available volume per route. |
Weight Utilization |
Average ratio of carried to maximum weight per route. |
Time Utilization Driving |
Share of driving time in total vehicle operation. |
Time Utilization Loading/Unloading |
Share of loading/unloading time in total vehicle operation. |
Time Utilization Waiting |
Share of waiting time in total vehicle operation. |
Time Utilization Layover |
Share of layover time in total vehicle operation. |
Number of Layovers |
Total number of layovers taken. |
Average Layover Duration |
Average duration of the layovers taken. |
Average Number of Stops per Route |
Average number of stops made per route. |
Distance |
Total distance covered by the vehicle. |
Route Schedule
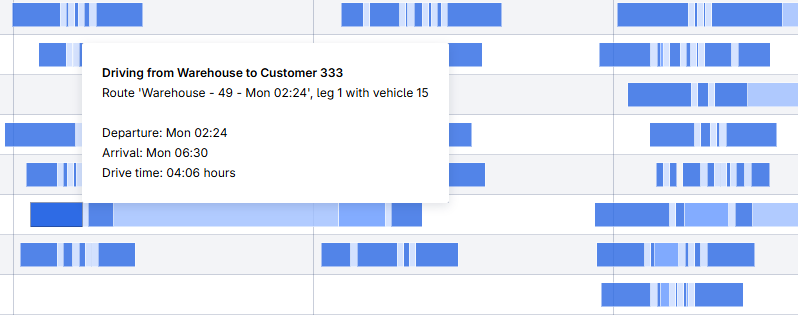
The Route Schedule tab shows the results in a clear Gantt chart format. It allows you to get a quick overview of the solution, by displaying bars for the driving time, the waiting time, the service time and the layover time for the vehicles on all legs and routes. These four different phases are displayed in different shades of blue, with the drive time as the darkest and therefore the most eye-catching. Each row in the Gantt chart shows all routes driven by a vehicle from a warehouse.
You can filter the Gantt chart on any combination of Vehicle, Warehouse, and Customer.
When hovering over any bar, a tooltip will show more details on that particular bar, as shown in the figure below.