Power BI Embedded
Introduction
The Power BI Embedded functionality allows you to build a customized Power BI report based on SC Navigator results, without setting up the necessary infrastructure as that is all done in the background. The model currently only supports a single report, as Power BI does not look at or manage multiple users efficiently. Therefore, if multiple people in your organization are working on a report, it is important not to work simultaneously, as changes might get lost. Power BI Embedded is only available in the Power BI Embedded Module.
(Results) Dataset
Datasets can be made available in two ways in Power BI Embedded.
The first way is via the “Save Results” dialog and by checking “Export to Data Lake/Power BI”, like this:

After you click save, the data will be saved and available in Power BI Embedded with the name you provided.
The second way is done automatically after the results of a solve are loaded. Upon loading of the results, that data is also uploaded to Power BI Embedded and available as “_current_<yourname>_N”, where N is an integer between 0 and 9. Normally, only the last one will be visible, but in some cases it might take some time to remove the previous data set, so you might see two.
Power BI Menu
The Power BI menu contains the most important button of this page: the “Save” button. You can find it all the way to the right or in the “File” menu on the left, see picture below.

The reason this is the most important button, is that Power BI does NOT automatically save. Leaving this page without clicking the Save button, means that all the unsaved changes are lost. We recommend regularly clicking the Save button to make sure that no changes are lost. (Note that the “Save As” button in the file menu does not do anything.)
Edit/View Mode
Power BI Embedded has two modes: Edit and View. In Edit mode, you can customize the report by adding new objects, pages, and filters. In View mode, you can only view the created results and use the selected filters. By default, everybody can both Edit and View. The default mode is Edit, but that can be changed via a drop down menu on the Edit/View Mode side panel:
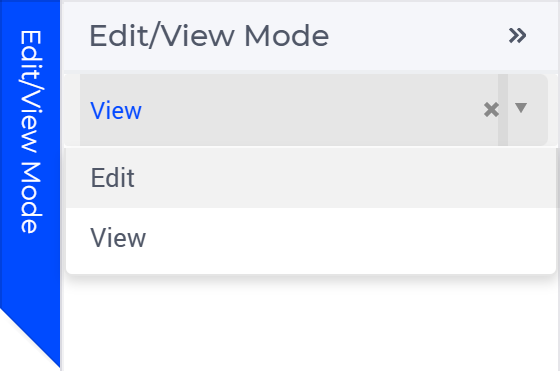
In case you want to restrict certain users from being able to edit the report, you need to create a group on the platform called “Power BI View Only”. After you have created this group, you need to add the users to this group that should not be able to edit.
Frequently Asked Questions
Q: Where does Power BI Embedded pull data from, and how can I filter which dataset it uses?
A: Power BI Embedded accesses all Results Datasets saved to the Azure Data Lake. The Results Datasets are only stored in the Azure Data Lake if you check the ‘Export to Data Lake/Power BI’ option when saving the result data, but the latest results are automatically saved there when loading them and will become available as “_current_<yourname>_N”, where N is an integer between 0 and 9. If you have just saved some Result Data to the Data Lake, you may need to wait a couple of minutes and refresh Power BI to see it. You can filter for the Dataset column in your result tables, or you can add a page-wide or a report-wide filter to your report for _dataset_info[Dataset]. Slicing based on these columns also makes it easy to compare different scenarios in your report.
Q: How and when should I save my report?
A: You can use both the Save button in the top right corner and the Save option in the File drop-down menu in the top left corner. We recommend not using the Save As functionality there, because it does NOT make it possible to recover a report by name. After editing the report, save it before reloading the page, navigating to another SC Navigator page, or leaving your workspace for an extended period. Otherwise, your changes will be lost.
Q: Does Power BI Embedded have all the functionality of regular Power BI?
A: Power BI Embedded has the same functionality as the Power BI web-based version. This means you can create visuals using the available data from your scenarios. Power BI Embedded does not support the same functionality as Power BI Desktop. The main differences are that it is not possible to create new variables and that it is not possible to add external data to the dashboard. See the table below for a comparison:
Power BI Embedded |
Power BI Desktop |
|---|---|
SC Navigator as data source |
Any data source |
Use existing data only, the data model follows the SC Navigator data model |
Transformation and modeling of data |
Not possible to do calculations; only existing data can be used |
Create measures (create calculated data based on existing data, example: margin = revenue - costs) |
Blank Power BI report (no preset styling or formatting) |
Ability to create themes and custom styling |
Standard visuals |
Ability to extend with ‘more visuals’ |
For a more extensive comparison, see this documentation from Microsoft.
Q: Can I export the dashboards to regular Power BI?
A: At this point, Microsoft does not support this functionality.