Optimize and Analyze
With SENSAI Pro, you can change Control Panel settings, run the optimization, save and compare results, and run sensitivity analyses, by describing what you want in the chat. This page describes each of these capabilities, with example requests. Replace the names in the examples with the names in your own dataset.
To look up or change input data first, see Work with Your Data.
Change Control Panel Settings
SENSAI Pro can change the settings on the Control Panel:
Objective: switch between Minimize Cost, Maximize Revenue and Maximize Profit, and choose which custom objectives are included in the model objective and with which scaling factor. See Optimization Options.
Objective bounds: set the minimum required and maximum allowed value of the total cost, the total revenue or a custom objective, in total or by location, activity type or mode of transport. See Custom Objectives Tables.
Model control options: relax minimum or maximum capacities, relax the minimum or maximum number of suppliers, production facilities, warehouses or locations, allow unfulfilled demand, relax lead time, drive time and source or destination limits, enforce the transportation base case, and enforce end-to-end lead times. See Model Control.
Considered products: include or exclude products from the optimization. See Considered Product Widget.
Solver settings: set the time limit and the optimality gap.
Location open/close data: set location fixed costs, force a location open or closed, and require flow to be dispatched or received through a warehouse. See Location Open/Close Data Table.
Minimum and maximum numbers: set the minimum and maximum number of locations, suppliers, production facilities and warehouses per period. See Min/Max Constraints Table.
Example requests include:
“Change the objective to Maximize Profit.”
“Relax the maximum warehouse capacity and run the model.”
“Allow at most 3 warehouses to be open in each period.”
“Limit total carbon emissions to 50000 tons.”
“Set the optimality gap to 0.5% and the time limit to 2 hours.”
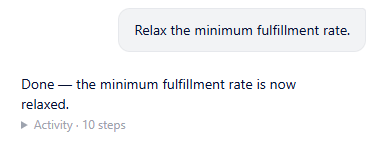
SENSAI Pro applies the same linked settings as the Control Panel. For example, relaxing the minimum fulfillment rate also allows unfulfilled demand. It does not always mention a linked setting in its reply. Ask “List all changes you have made so far” to see it. Undo does not revert these linked settings. See Review and Undo Changes. If your subscription does not allow an option to be changed, or data changes are not allowed, it tells you and leaves the option unchanged.
Run the Optimization and Save Results
SENSAI Pro can run the optimization on the current data and save the results under a name of your choice, so you can load and compare them later. After a run, it reports the solve status. If the model is infeasible, it reports that and does not save the results.
Example requests include:
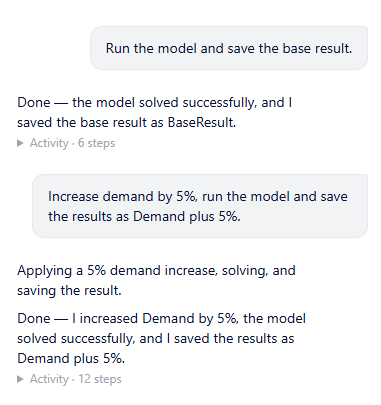
“Run the model and save the base result.”
“Increase demand by 5%, run the model and save the results as Demand plus 5%.”
“Run the model with demand changes of -5%, +5% and +10%, and save each result.”
“Which saved results can I load?”
“Load the saved result Demand plus 5%.”
When you ask for several runs that each apply a percentage change, SENSAI Pro applies each change to the original data, so the changes are not stacked on top of each other.
Note
A result name must be unique and must not contain any of the characters # * + | \ < > ? , / :. For example, use “Demand plus 5%” rather than “Demand +5%”. If you do not give a name, SENSAI Pro chooses one and tells you.
Compare Results
SENSAI Pro can compare saved results at KPI level. It can compare:
Total cost, total revenue and the objective value
Cost per cost type and per period
Service KPIs: demand, demand fulfillment, weighted average lead time, cost per UOM, and the number of open suppliers, production facilities and warehouses
Custom objective values, such as emissions, per period
Example requests include:
“Compare the total cost, revenue and objective value of my saved results.”
“Which saved result has the lowest total cost?”
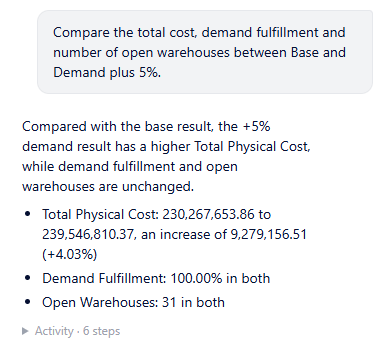
“Compare the total cost, demand fulfillment and number of open warehouses between Base and Demand plus 5%.”
“Compare the demand fulfillment and the number of open warehouses across my saved results.”
“Run the model, then tell me what changed compared to before.”
If a comparison needs a baseline, for example “What changed compared to before?”, and you have not saved or named one, SENSAI Pro first runs the model on the current data and saves the result as the baseline.
Note
Objective values can only be compared between results that were solved with the same objective, such as Minimize Cost. Compare total cost and revenue instead when the objectives differ.
For detailed results per warehouse, lane or customer, use the Results pages and the Compare Results page.
Sensitivity Analysis
A sensitivity analysis shows how your results react when one input changes over several levels. SENSAI Pro changes the input by each percentage level, runs the optimization for each level, and summarizes the results.
You can specify the levels in two ways:
As a range, for example “from -10% to +10% in steps of 5%”.
As a list, for example “2%, 5% and 7%”.
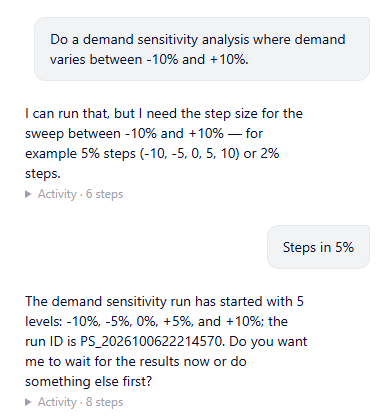
If you give a range without a step size, SENSAI Pro asks for one. If you give no levels at all, it uses 5% to 20% in steps of 5%. You can restrict the analysis to part of the data, for example one warehouse, one product or one period.
Example requests include:
“Do a demand sensitivity analysis where demand varies between -10% and +10%.”
“Run a sensitivity analysis on the maximum capacity of Antalya_FG for +10%, +25% and +50%.”
“Test transport cost increases of 5%, 10% and 15% for lanes in 2023-H2.”
“Analyze my last sensitivity analysis.”
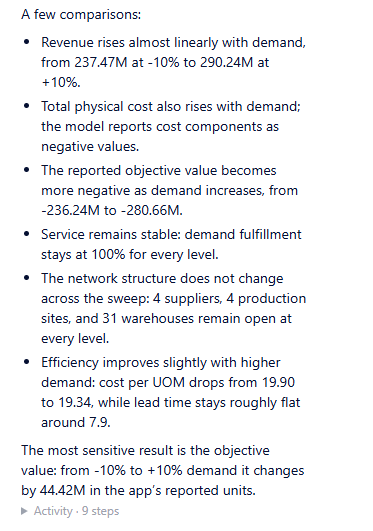
The runs start in the background. As soon as they have started, your input data is back at its original values, so you can continue working with it. SENSAI Pro gives you the ID of the analysis and asks whether you want to wait for the results. You can also come back later, even in a new conversation, by asking SENSAI Pro to analyze the run. When the runs are finished, it summarizes how the KPIs change per level: the trend, which KPI reacts most strongly, and any level that could not be solved.