Compare Results
After selecting an active results dataset and results dataset(s) to compare (as described here: Save and Compare Results), the Compare Results page gives an overview of the main differences between the selected datasets. The page is divided into two main parts:
Summary Tables
The first part of the page shows the most important KPIs in separate tables. These tables make it possible to compare the selected results datasets side by side and to review the difference in the Delta columns.
The following summary tables are available:
Objective Value
Profit
Service
Physical Cost Details
Custom Objectives
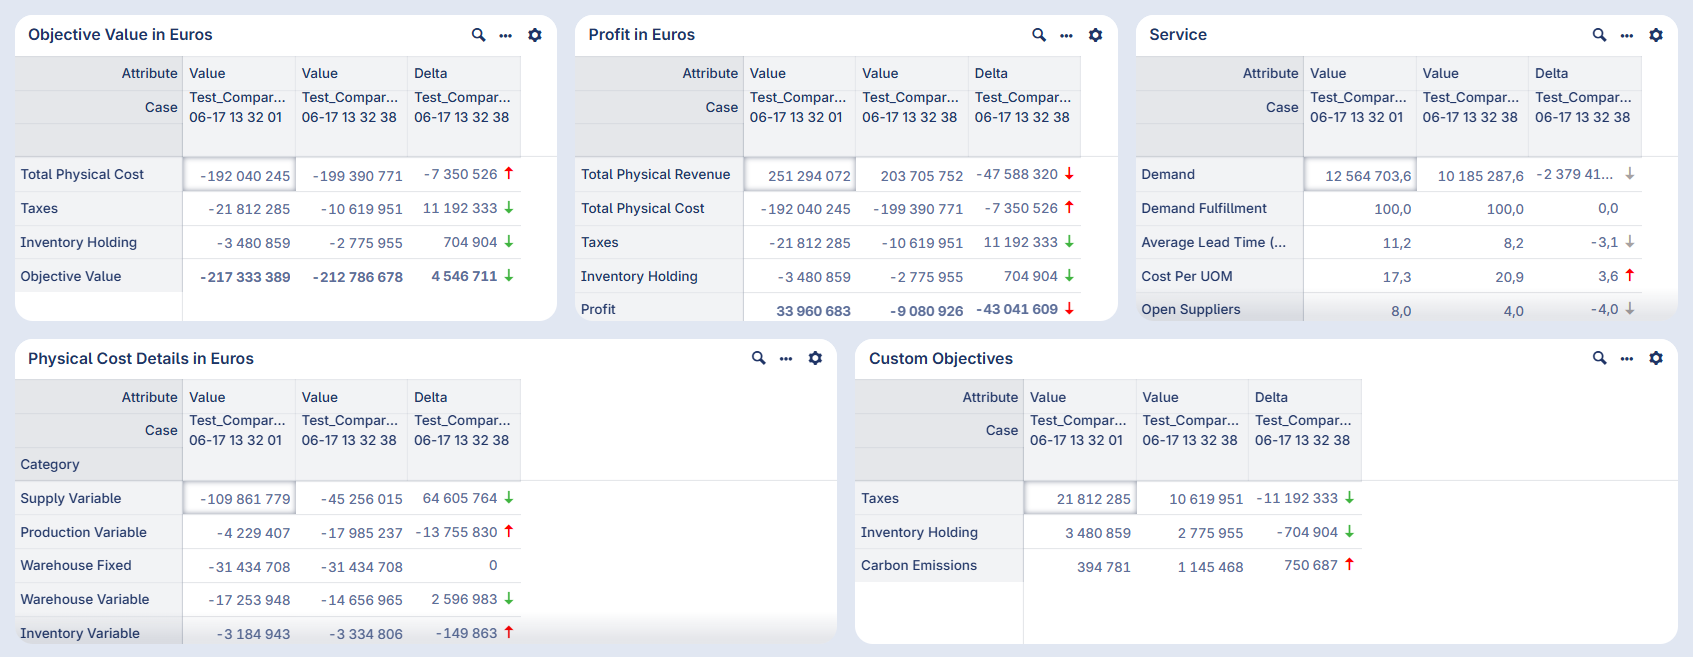
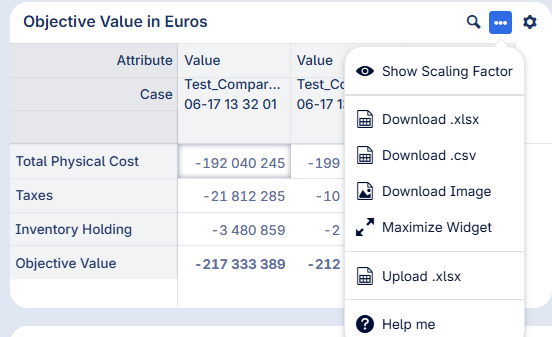
The Objective Value table shows the main components of the objective value. It includes cost or revenue elements such as physical cost, custom objectives, physical revenue, and the final objective value. The Delta column helps you identify which components changed between the active result and each compare result. By using the widget actions icon in the upper right corner of this table, you can select Show Scaling Factor. This action displays the scaling factor used for each component.
The Profit table shows the revenue and cost components used to calculate profit. It includes values such as total physical revenue, total physical cost, taxes, inventory holding, and profit. The Delta column helps you identify which components changed between the active result and each compare result.
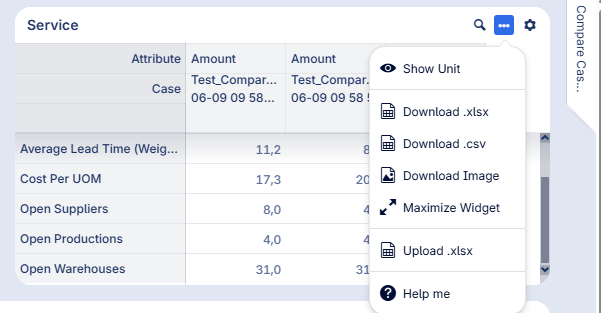
The Service table shows service related KPIs, such as demand, demand fulfillment, average lead time, cost per UOM, and the number of open suppliers, productions, and warehouses. By using the widget actions icon in the upper right corner of this table, you can select Show Units. This action displays the unit of measure for the service KPIs.
The Physical Cost Details table provides a more detailed breakdown of the physical cost. For example, it can show supply variable cost, production variable cost, warehouse fixed and variable cost, inventory variable cost, and transport cost. This table is useful when the total physical cost has changed and you want to understand which cost category caused the difference.
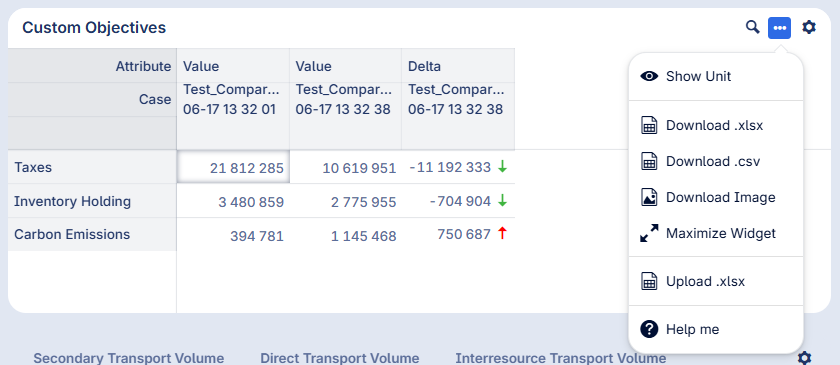
The Custom Objectives table shows the custom objective values included in the selected results. By using the widget actions icon in the upper right corner of this table, you can select Show Units. This action displays the units used by the custom objective values.
Volume Comparison
The second part of the page contains volume comparison tables. These tables show the largest volume differences between the active results dataset and each compare results dataset. The following tabs are available:
Supplier Volume
Production Volume
Warehouse Volume
Customer Fulfillment
Primary Transport Volume
Secondary Transport Volume
Direct Transport Volume
Interresource Transport Volume
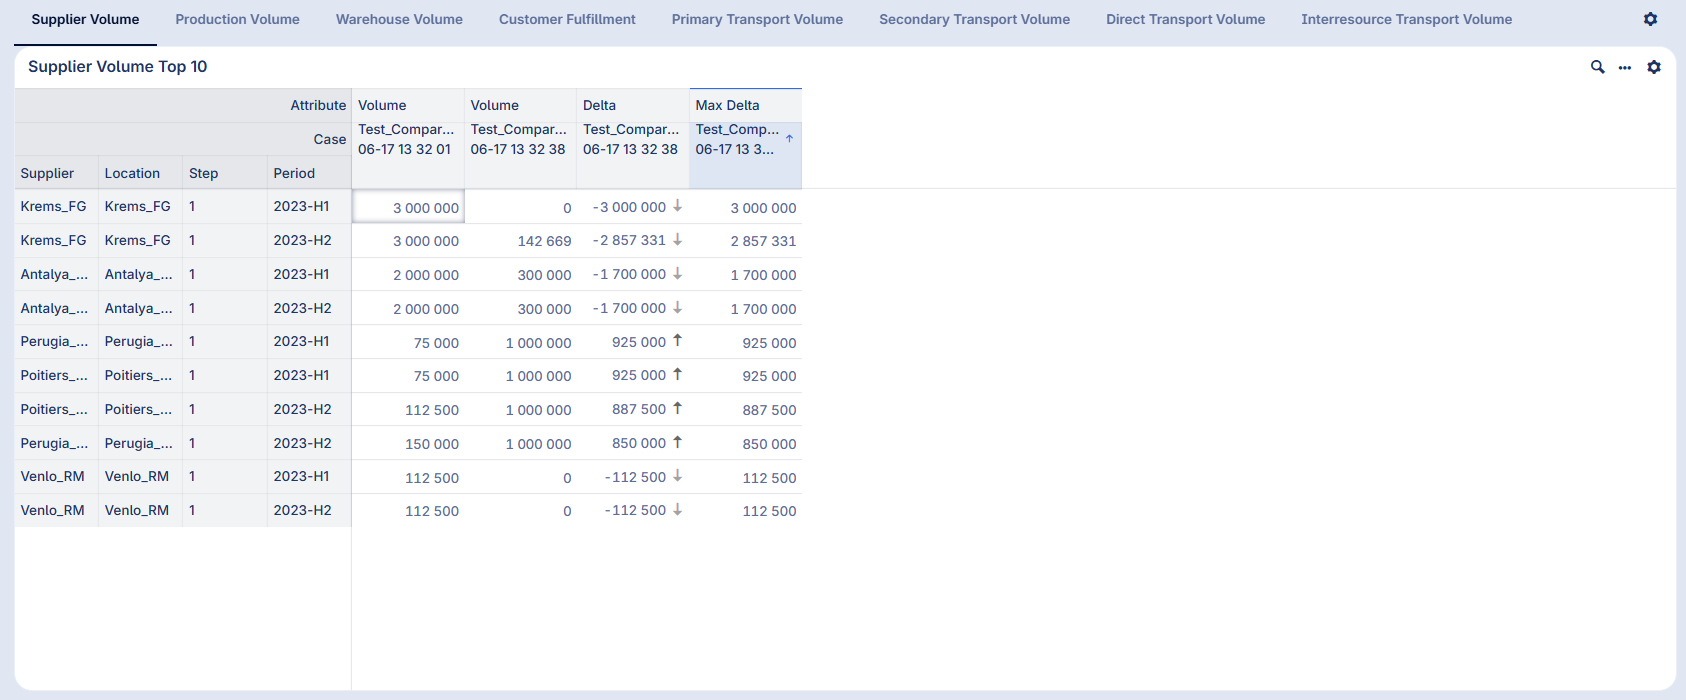
Each tab shows the relevant attributes of the selected volume type, the values in the selected results datasets, and the Delta between the active and each compare results dataset. The Max Delta column can be used to quickly find the largest difference between the active dataset and any compare dataset in a specific row. The Max Delta column is in descending order.
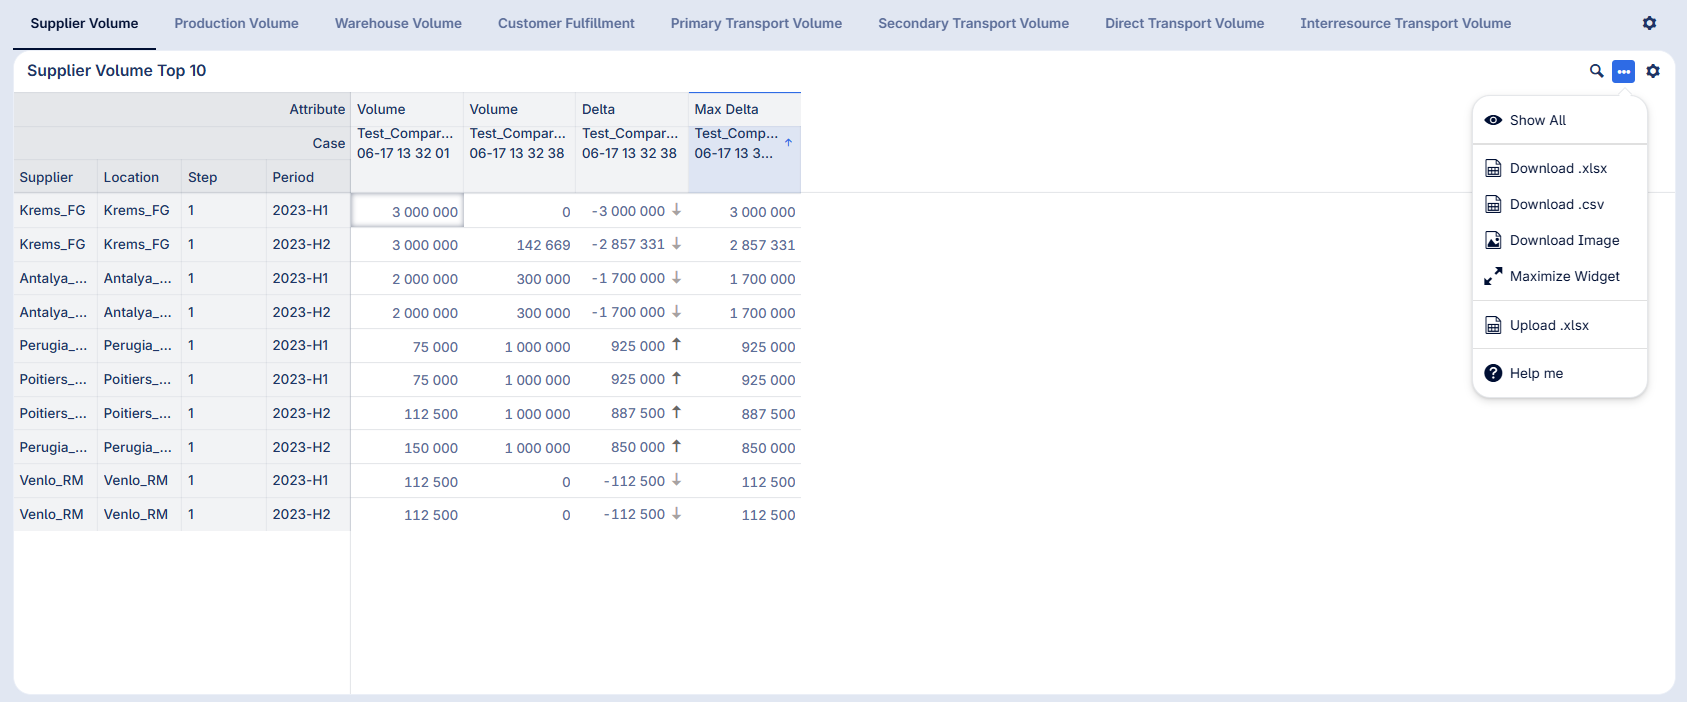
By default, the volume comparison tables show the 10 rows with the largest Max Delta value. If you want to review all rows instead of only the top 10, click the widget actions icon in the upper right corner of the table and select Show All. This expands the table so that all available rows are displayed.
In the tables of this page, arrows/colors indicate increases/decreases in the observed values and help identify favorable or unfavorable changes depending on KPI type. This makes it easier to see at a glance where the compared results increased or decreased.
Select Compare Results
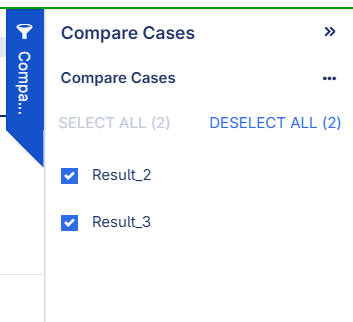
The Compare Results page also contains the Compare Cases side panel, which can be used to select which loaded compare results datasets are visible. Only the selected compare datasets are shown in the tables on this page alongside the active results dataset, and the Max Delta values are calculated using only these datasets.